
The Reformist CTO’s Guide to Impact Intelligence
The productivity of knowledge workers is hard to quantify and often decoupled from direct business outcomes. The lack of understanding leads to many initiatives, bloated tech spend, and ill-chosen efforts to improve this productivity. Technology leaders need to avoid this by developing an intelligence of the business impact of their work across a network connecting output to proximate and downstream impact. We can do this by introducing robust demand management, paying down measurement debt, introducing impact validation, and equipping delivery teams to build a picture of how their work translates to business impact.
12 August 2025

Sriram Narayan is an independent consultant on the topic of impact intelligence. He also helps clients improve digital, product and tech performance. Pearson published his first book, Agile IT Org Design, in 2015.
While at ThoughtWorks, Sriram served in product, technology, innovation, and transformation leadership roles. He helped some of his clients move to a product operating model. His 2018 article on the topic has since become an industry reference. Along the way, he created Cleararchy, a formulation for organizing hierarchy for the digital age.

The book explains why and how the C-Suite Core should care about this topic. It consists of 16 chapters across five parts: (1) Introduction (2) Improving Impact Intelligence (3) Reimagining Initiatives (4) Guidance for low-maturity orgs, and (5) Finale. The article here presents key elements of Part Two although the book gets into greater detail and has more worked examples illustrating simple impact attribution. Besides this, Part Two in the book explores the clash of cultures between businesspeople and data people, and a way to resolve the clash. It also weaves everything together into a framework of eight modules with a suggested adoption sequence. For a summary of the other parts, please see the book outline included in this free preview.
Impact Intelligence is the title of my latest book. It explains how to improve awareness of the business impact of new initiatives. The Classic Enterprise thinks of the expenditure on these initiatives as discretionary spend. A software business might account for it as R&D expenditure. Written with a framing of investment governance, the book is aimed at the execs who approve investments. They are the ones with the authority to introduce change. They also have the greatest incentive to do so because they are answerable to investors. But they are not the only ones. Tech CXOs have an incentive to push for impact intelligence too.
Consider this. You are a CTO or other tech CXO such as a CIO or CDO (Digital/Data). Your teams take on work prioritized by a Product organization or by a team of business relationship managers (BRM). More than ever, you are being asked to report and improve productivity of your teams. Sometimes, this is part of a budget conversation. A COO or CFO might ask you, “Is increasing the budget the only option? What are we doing to improve developer productivity?” More recently, it has become part of the AI conversation. As in, “Are we using AI to improve developer productivity?”. Or even, “How can we leverage AI to lower the cost per story point?” That’s self-defeating unit economics in overdrive! As in, it aims to optimize a metric that has little to do with business impact. This could, and usually does, backfire.
While it is okay to ensure that everyone pulls their weight, the current developer productivity mania feels a bit much. And it misses the point. This has been stressed time and again. You might already know this. You know that developer productivity is in the realm of output. It matters less than outcome and impact. It's of no use if AI improves productivity without making a difference to business outcomes. And that's a real risk for many companies where the correlation between output and outcome is weak.
The question is, how do you convince your COO or CFO to fixate less on productivity and more on overall business impact?
Even if there is no productivity pressure, a tech CXO could still use the guidance here to improve the awareness of business impact of various efforts. Or if you are a product CXO, that's even better. It would be easier to implement the recommendations here if you are on board.
Impact Trumps Productivity
In factory production, productivity is measured as units produced per hour. In construction, it might be measured as the cost per square foot. In these domains, worker output is tangible, repeatable, and performance is easy to benchmark. Knowledge work, on the other hand, deals in ambiguity, creativity, and non-routine problem-solving. Productivity of knowledge work is harder to quantify and often decoupled from direct business outcomes. More hours or output (e.g., lines of code, sprint velocity, documents written, meetings attended) do not necessarily lead to greater business value. That’s unless you are a service provider and your revenue is purely in terms of billable hours. As a technology leader, you must highlight this. Otherwise, you could get trapped in a vicious cycle. It goes like this.
As part of supporting the business, you continue to deliver new digital products and capabilities. However, the commercial (business) impact of all this delivery is often unclear. This is because impact-feedback loops are absent. Faced with unclear impact, more ideas are executed to move the needle somehow. Spray and pray! A feature factory takes shape. The tech estate balloons.
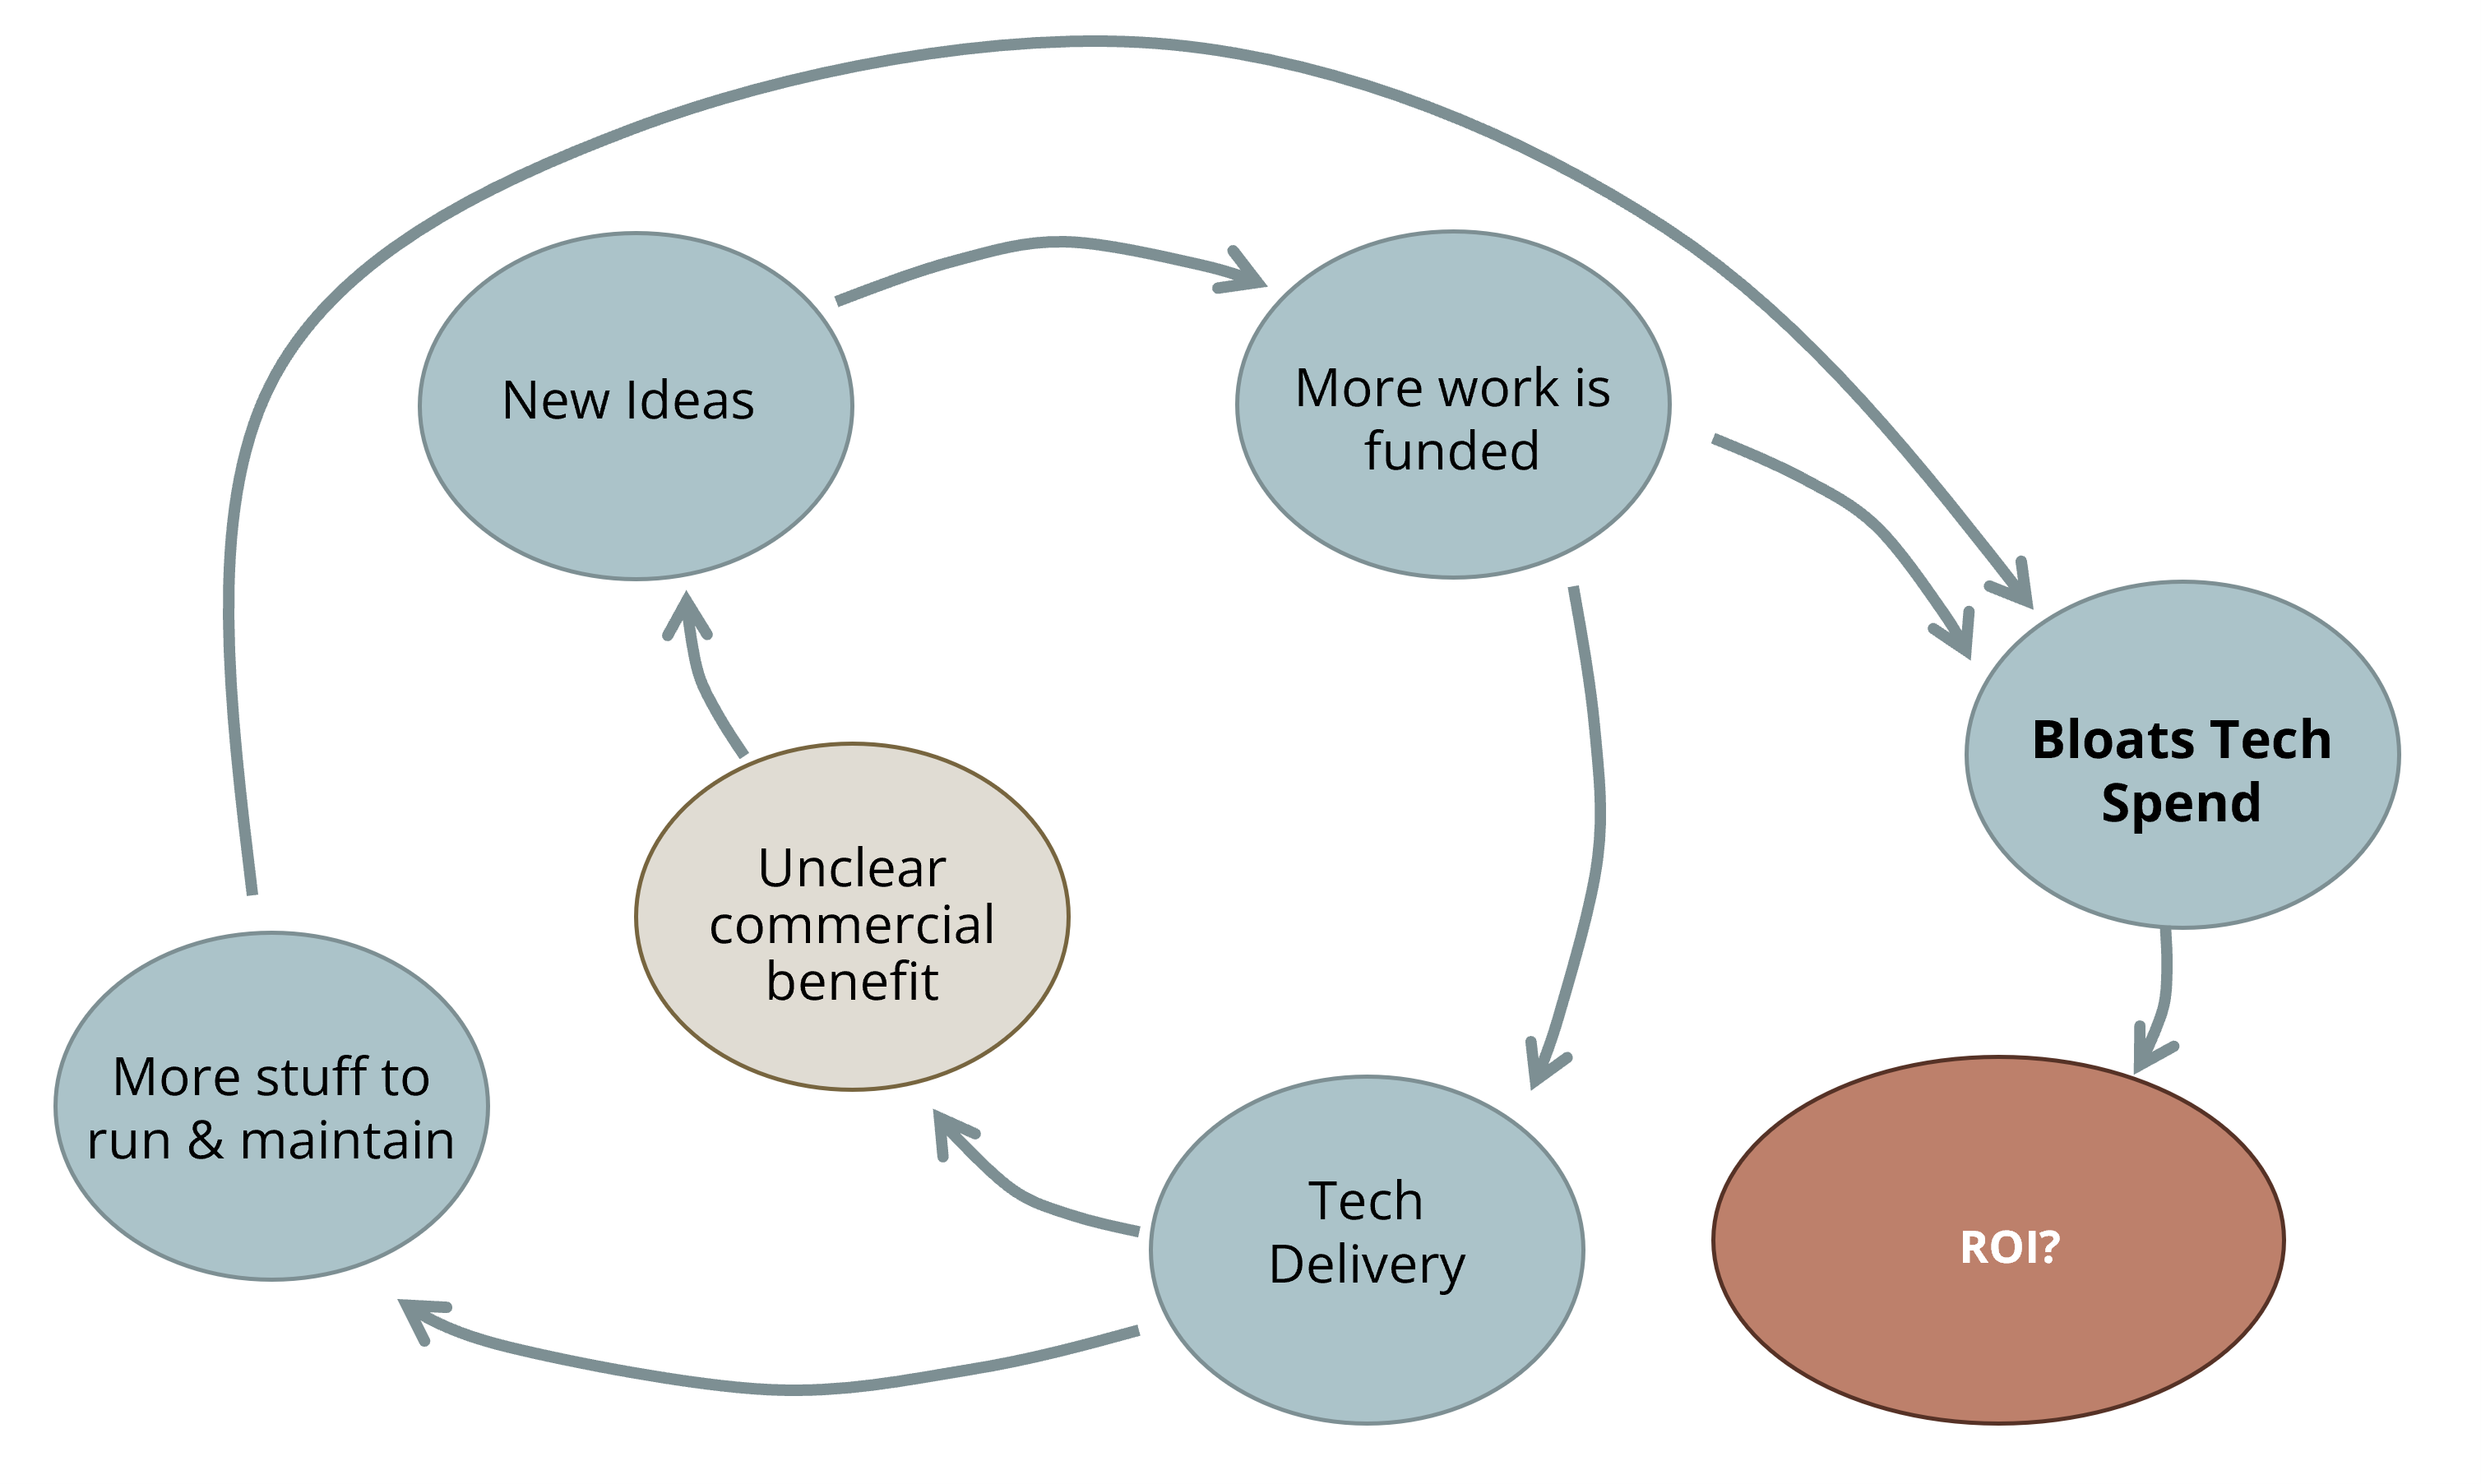
Figure 1: Consequences of Unclear Business Impact
All that new stuff must be kept running. Maintenance (Run, KTLO) costs mount. It limits the share of the budget available for new development (Change, R&D, Innovation). When you ask your COO or CFO for an increase in budget, they ask you to improve developer productivity instead. Or they ask you to justify your demand in terms of business impact. You struggle to provide this justification because of a general deficit of impact intelligence within the organization.
If you’d like to stop getting badgered about developer productivity, you must find a way to steer the conversation in a more constructive direction. Reorient yourself. Pay more attention to the business impact of your teams’ efforts. Help grow impact intelligence. Here’s an introduction.
Impact Intelligence
Impact Intelligence is the constant awareness of the business impact of initiatives: tech initiatives, R&D initiatives, transformation initiatives, or business initiatives. It entails tracking contribution to key business metrics, not just to low-level metrics in proximity to an initiative. Figure 2 illustrates this with the use of a visual that I call an impact network.
It brings out the inter-linkages between factors that contribute to business impact, directly or indirectly. It is a bit like a KPI tree, but it can sometimes be more of a network than a tree. In addition, it follows some conventions to make it more useful. Green, red, blue, and black arrows depict desirable effects, undesirable effects, rollup relationships, and the expected impact of functionality, respectively. Solid and dashed arrows depict direct and inverse relationships. Except for the rollups (in blue), the links don't always represent deterministic relationships. The impact network is a bit like a probabilistic causal model. A few more conventions are laid out in the book.
The bottom row of features, initiatives etc. is a temporary overlay on the impact network which, as noted earlier, is basically a KPI tree1 where every node is a metric or something that can be quantified. I say temporary because the book of work keeps changing while the KPI tree above remains relatively stable.
1: A couple of reviewers said that the impact network reminds them of other formulations. One pointed to cascading OKRs. Another pointed to Gojko Adzic's impact mapping. I guess it could remind you of any formulation that uses a tree-like visual to talk about impact. But a careful reading should convince you that the impact network stands on its own as a specific type of KPI tree. Its seeds were sown in an earlier visual called Alignment Maps.
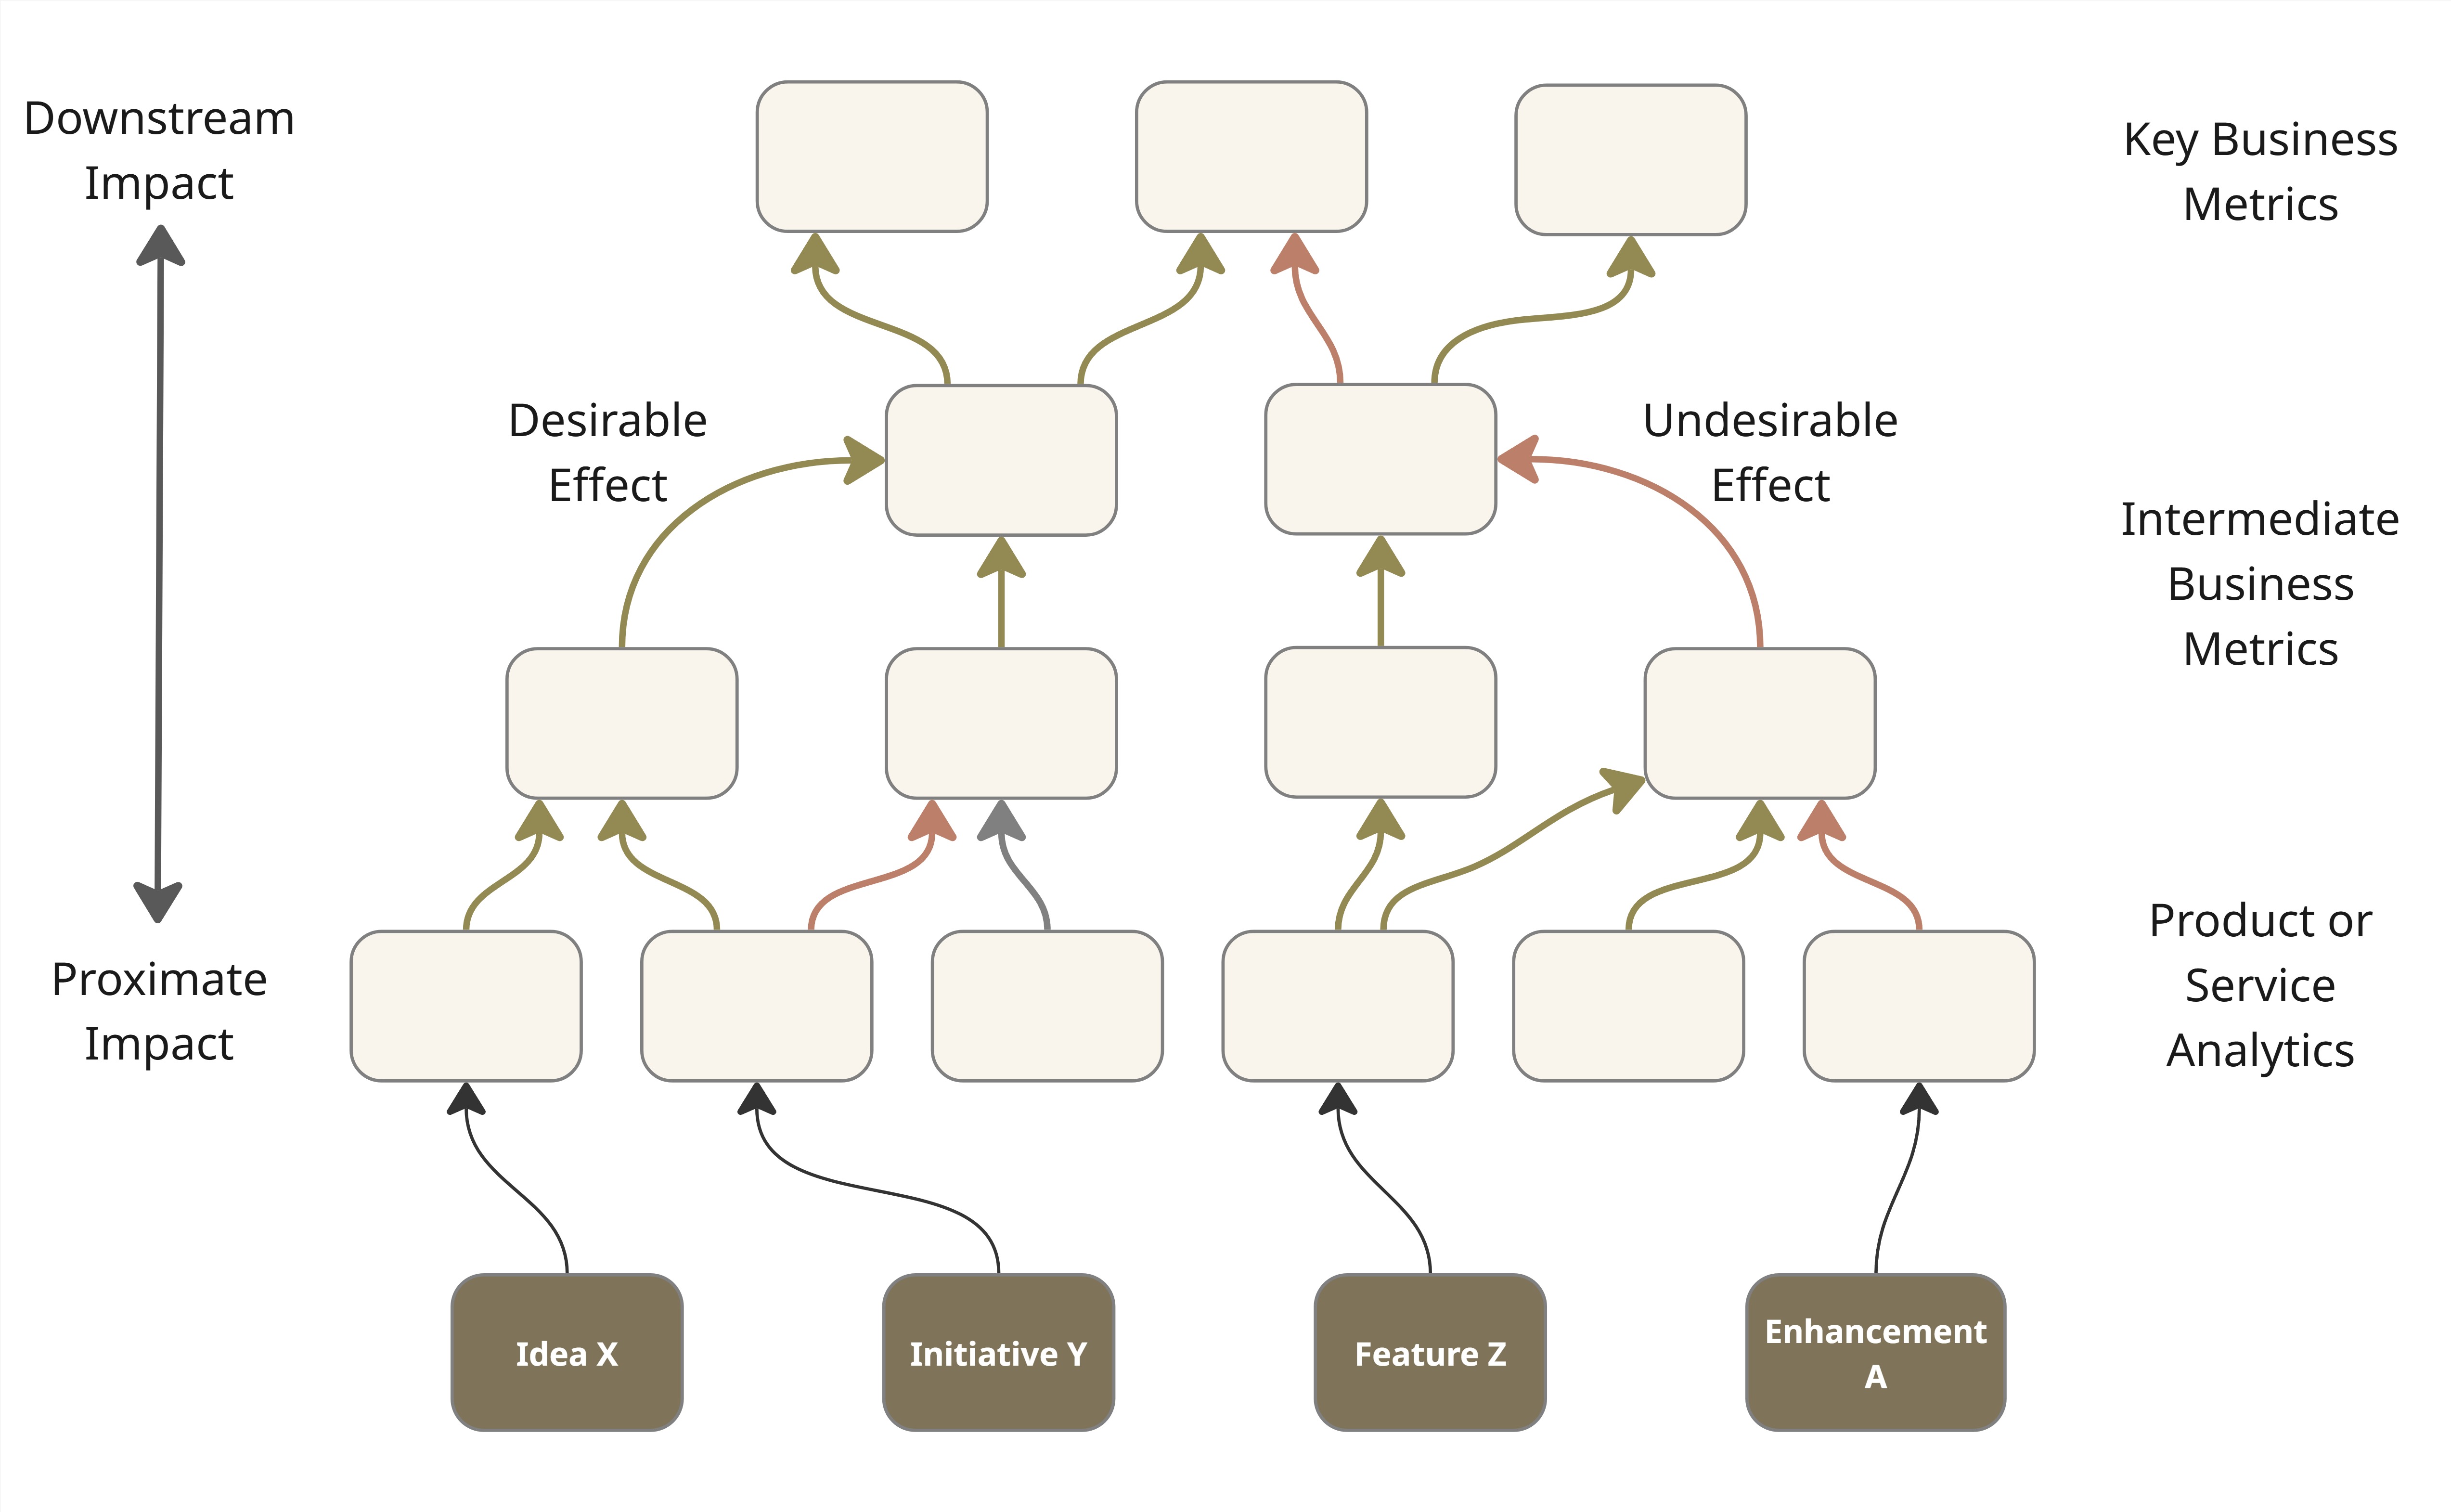
Figure 2: An Impact Network with the current Book of Work overlaid.
Typically, the introduction of new features or capabilities moves the needle on product or service metrics directly. Their impact on higher-level metrics is indirect and less certain. Direct or first-order impact, called proximate impact, is easier to notice and claim credit for. Indirect (higher order), or downstream impact, occurs further down the line and it may be influenced by multiple factors. The examples to follow illustrate this.
The rest of this article features smaller, context-specific subsets of the overall impact network for a business.
Example #1: A Customer Support Chatbot
What’s the contribution of an AI customer support chatbot to limiting call volume (while maintaining customer satisfaction) in your contact center?
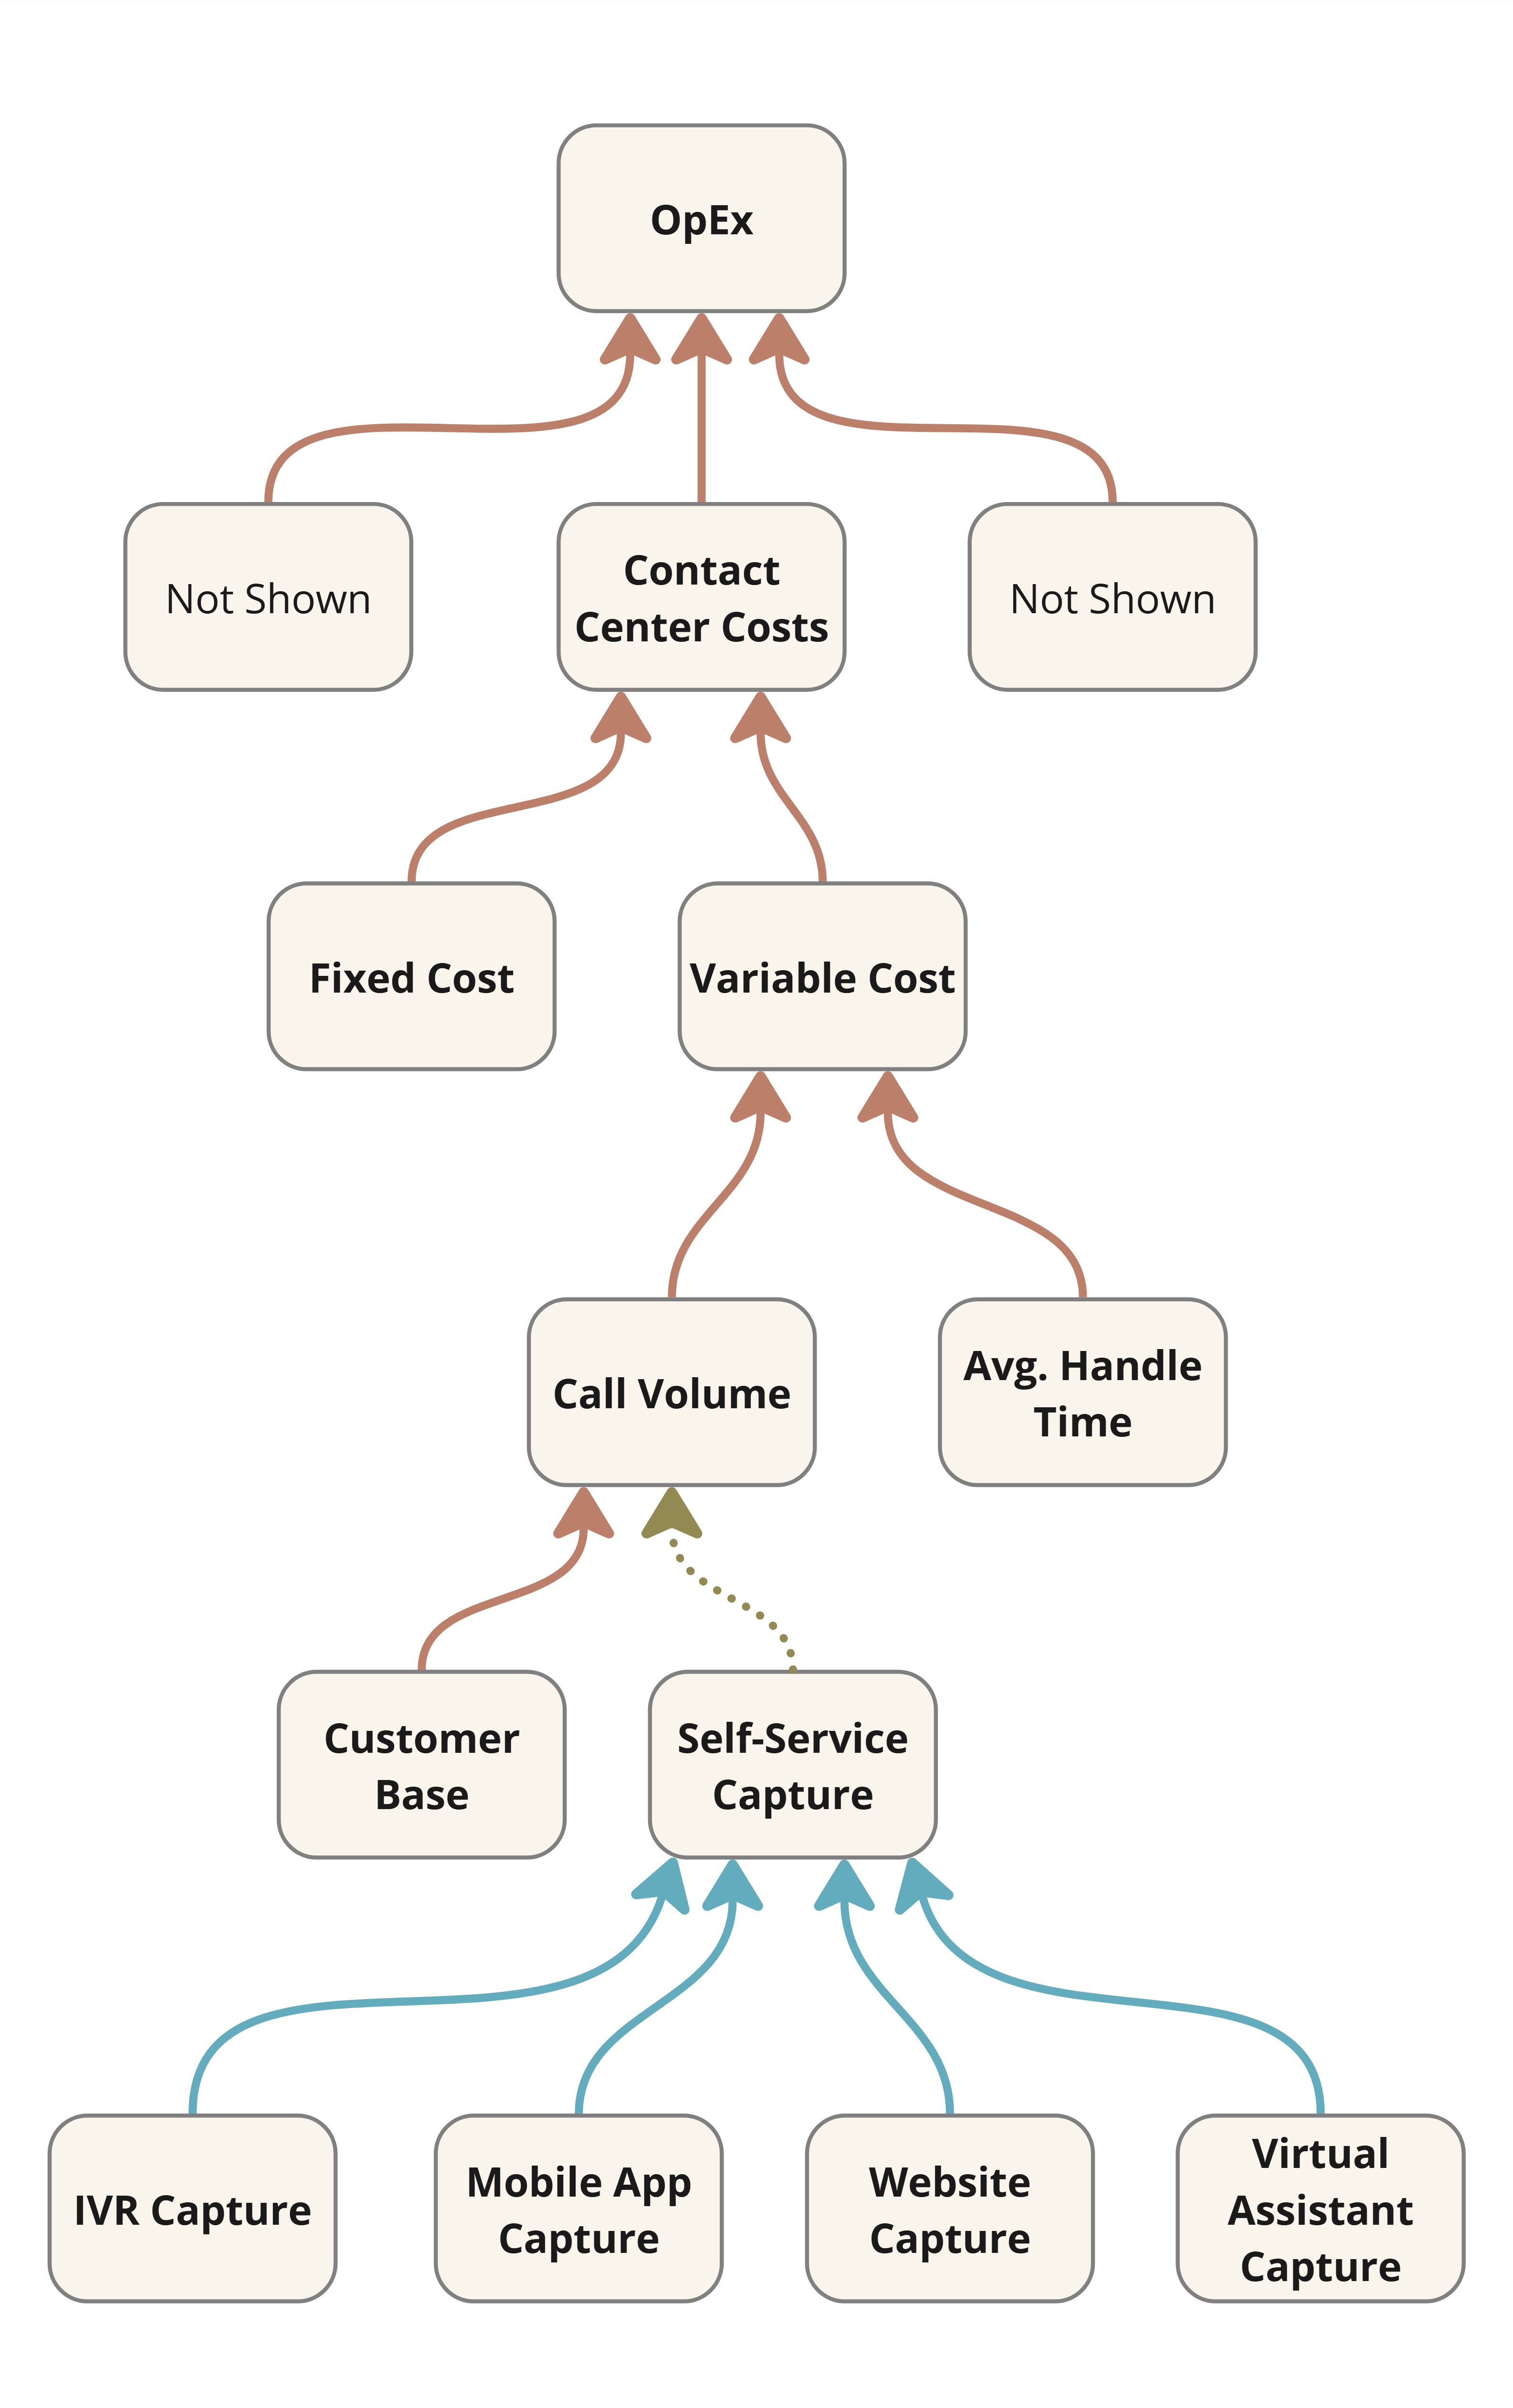
Figure 3: Downstream Impact of an AI Chatbot
It is not enough anymore to assume success based on mere solution delivery. Or even the number of satisfactory chatbot sessions which Figure 3 calls virtual assistant capture. That’s proximate impact. It’s what the Lean Startup mantra of build-measure-learn aims for typically. However, downstream impact in the form of call savings is what really matters in this case. In general, proximate impact might not be a reliable leading indicator of downstream impact.
A chatbot might be a small initiative in the larger scheme, but small initiatives are a good place to exercise your impact intelligence muscle.
Example #2: Regulatory Compliance AI assistant
Consider a common workflow in regulatory compliance. A compliance analyst is assigned a case. They study the case, its relevant regulations and any recent changes to them. They then apply their expertise and arrive at a recommendation. A final decision is made after subjecting the recommendation to a number of reviews and approvals depending on the importance or severity of the case. The Time to Decision might be of the order of hours, days or even weeks depending on the case and its industry sector. Slow decisions could adversely affect the business. If it turns out that the analysts are the bottleneck, then perhaps it might help to develop an AI assistant (“Regu Nerd”) to interpret and apply the ever-changing regulations. Figure 4 shows the impact network for the initiative.
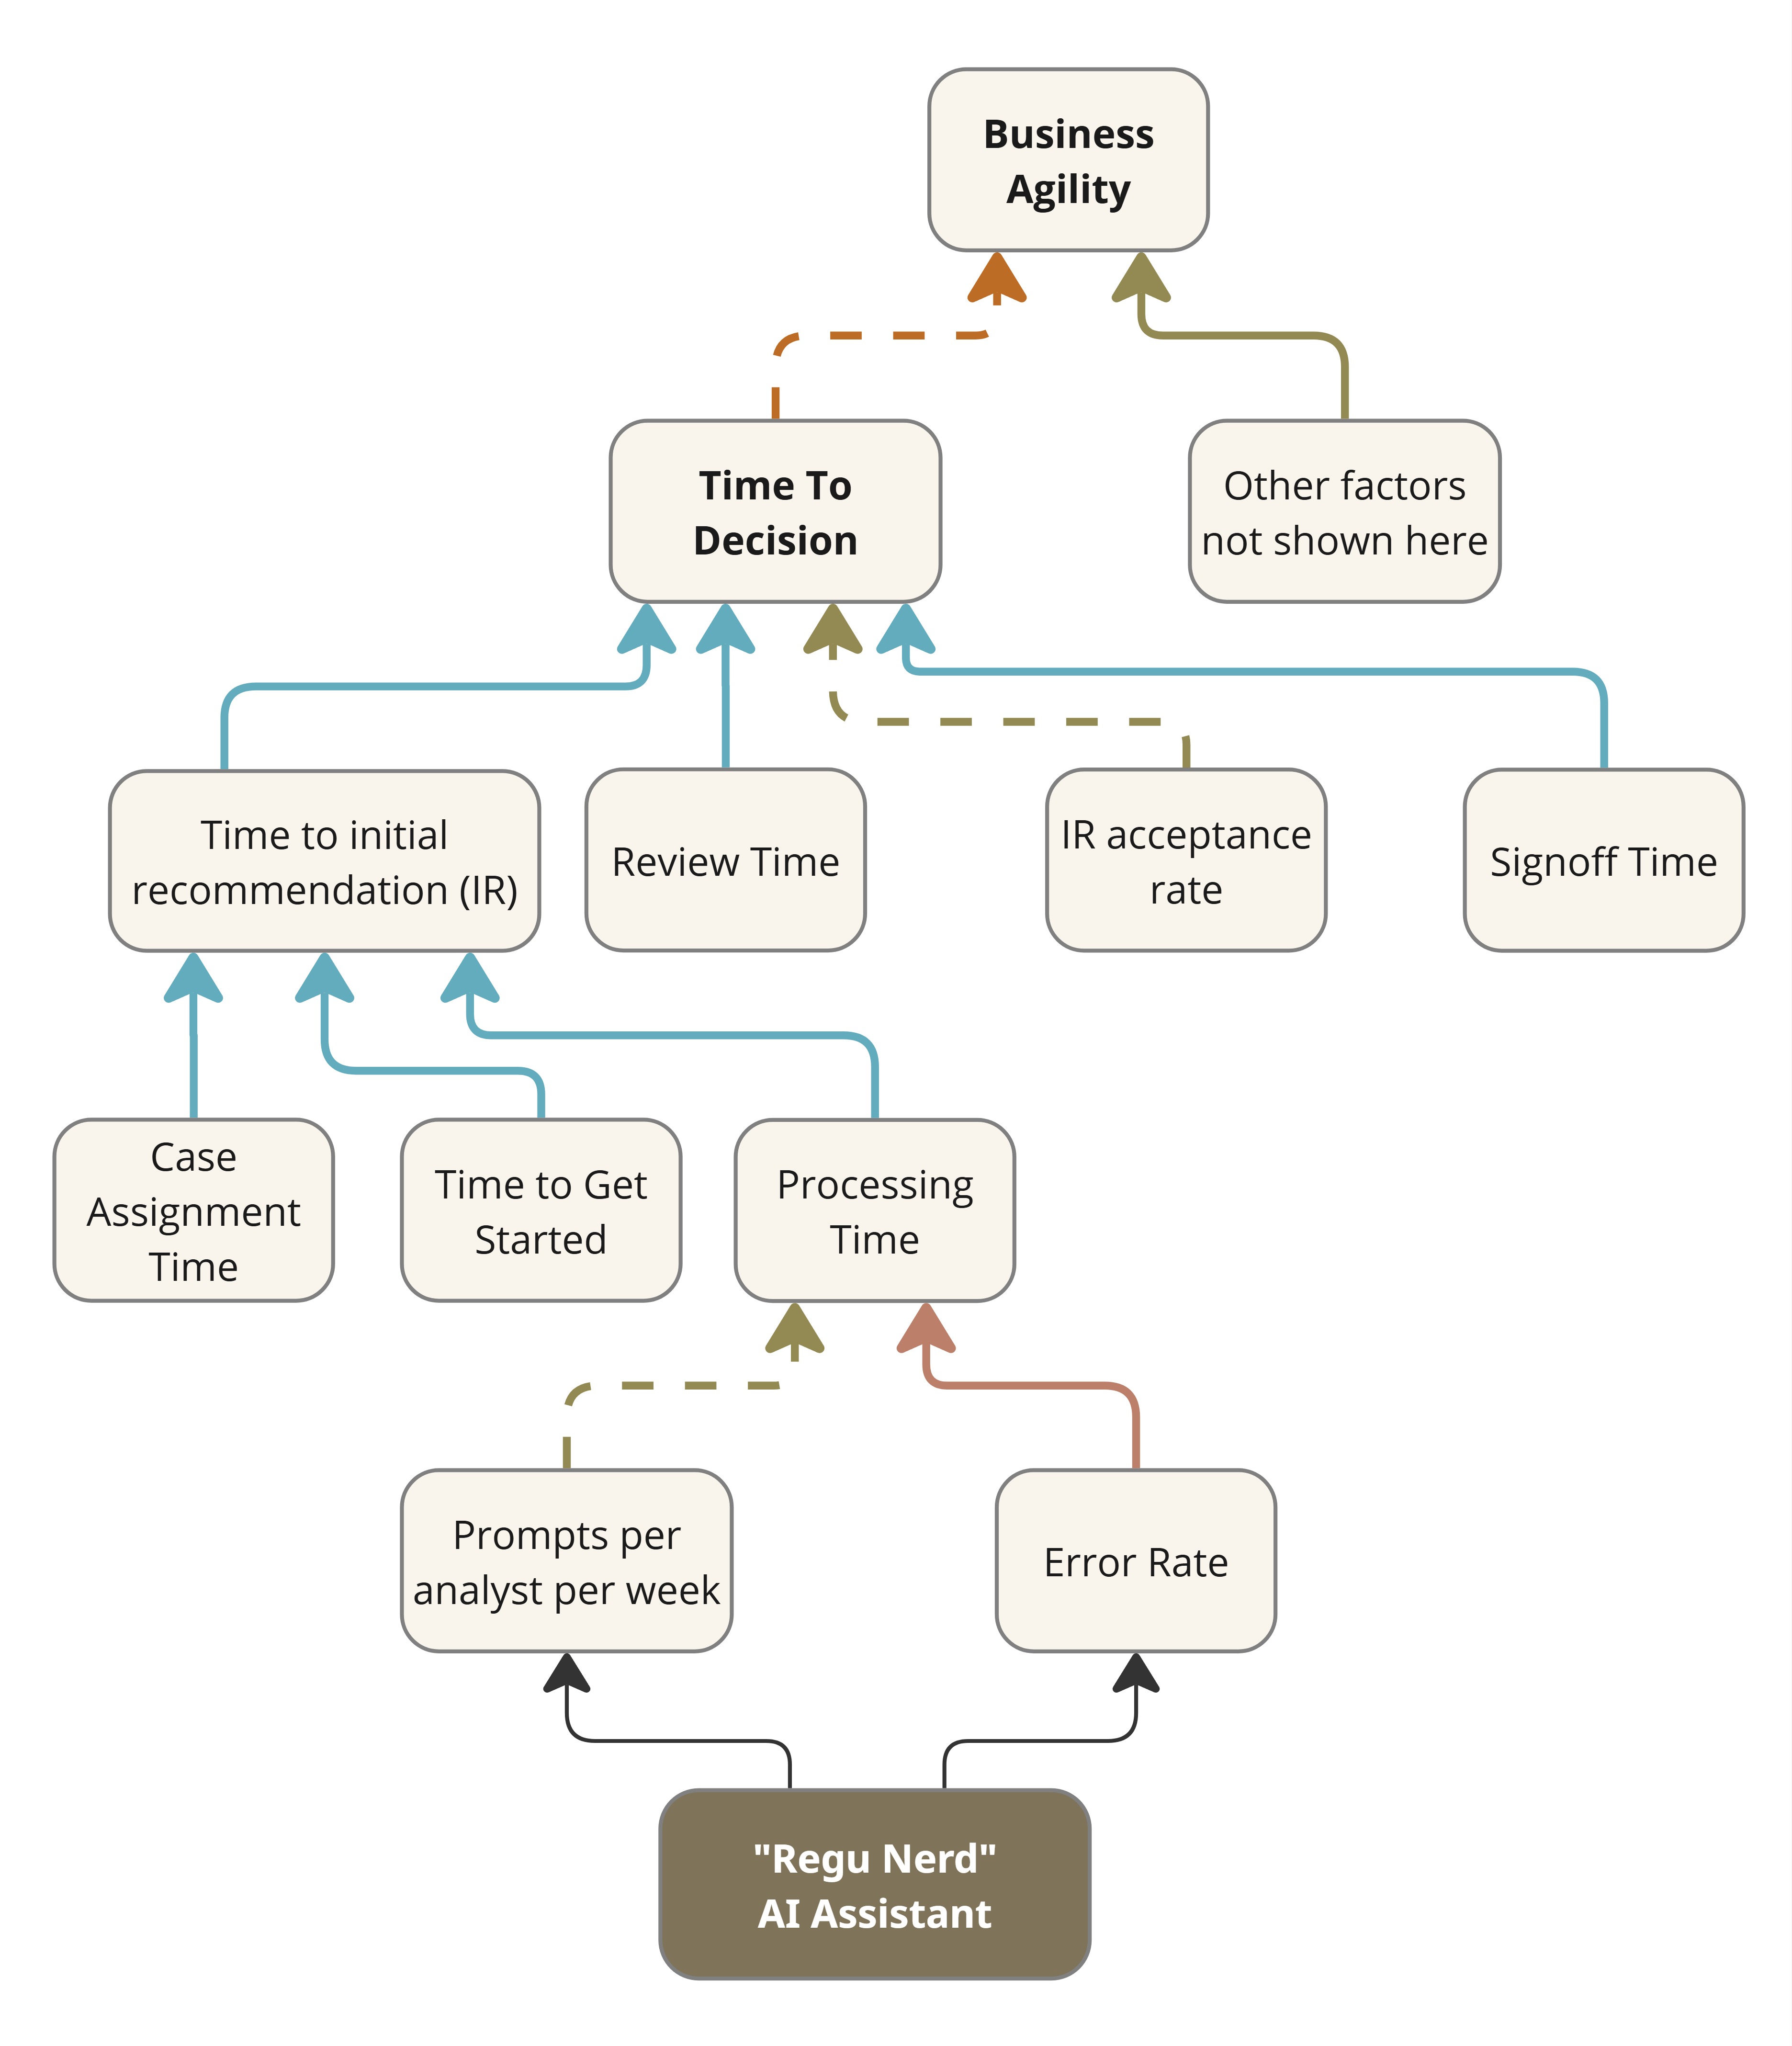
Figure 4: Impact Network for an AI Interpreter of Regulations
Its proximate impact may be reported in terms of the uptake of the assistant (e.g., prompts per analyst per week), but it is more meaningful to assess the time saved by analysts while processing a case. Any real business impact would arise from an improvement in Time to Decision. That’s downstream impact, and it would only come about if the assistant were effective and if the Time to initial recommendation were indeed the bottleneck in the first place.
Example #3: Email Marketing SaaS
Consider a SaaS business that offers an email marketing solution. Their revenue depends on new subscriptions and renewals. Renewal depends on how useful the solution is to their customers, among other factors like price competitiveness. Figure 5 shows the relevant section of their impact network.
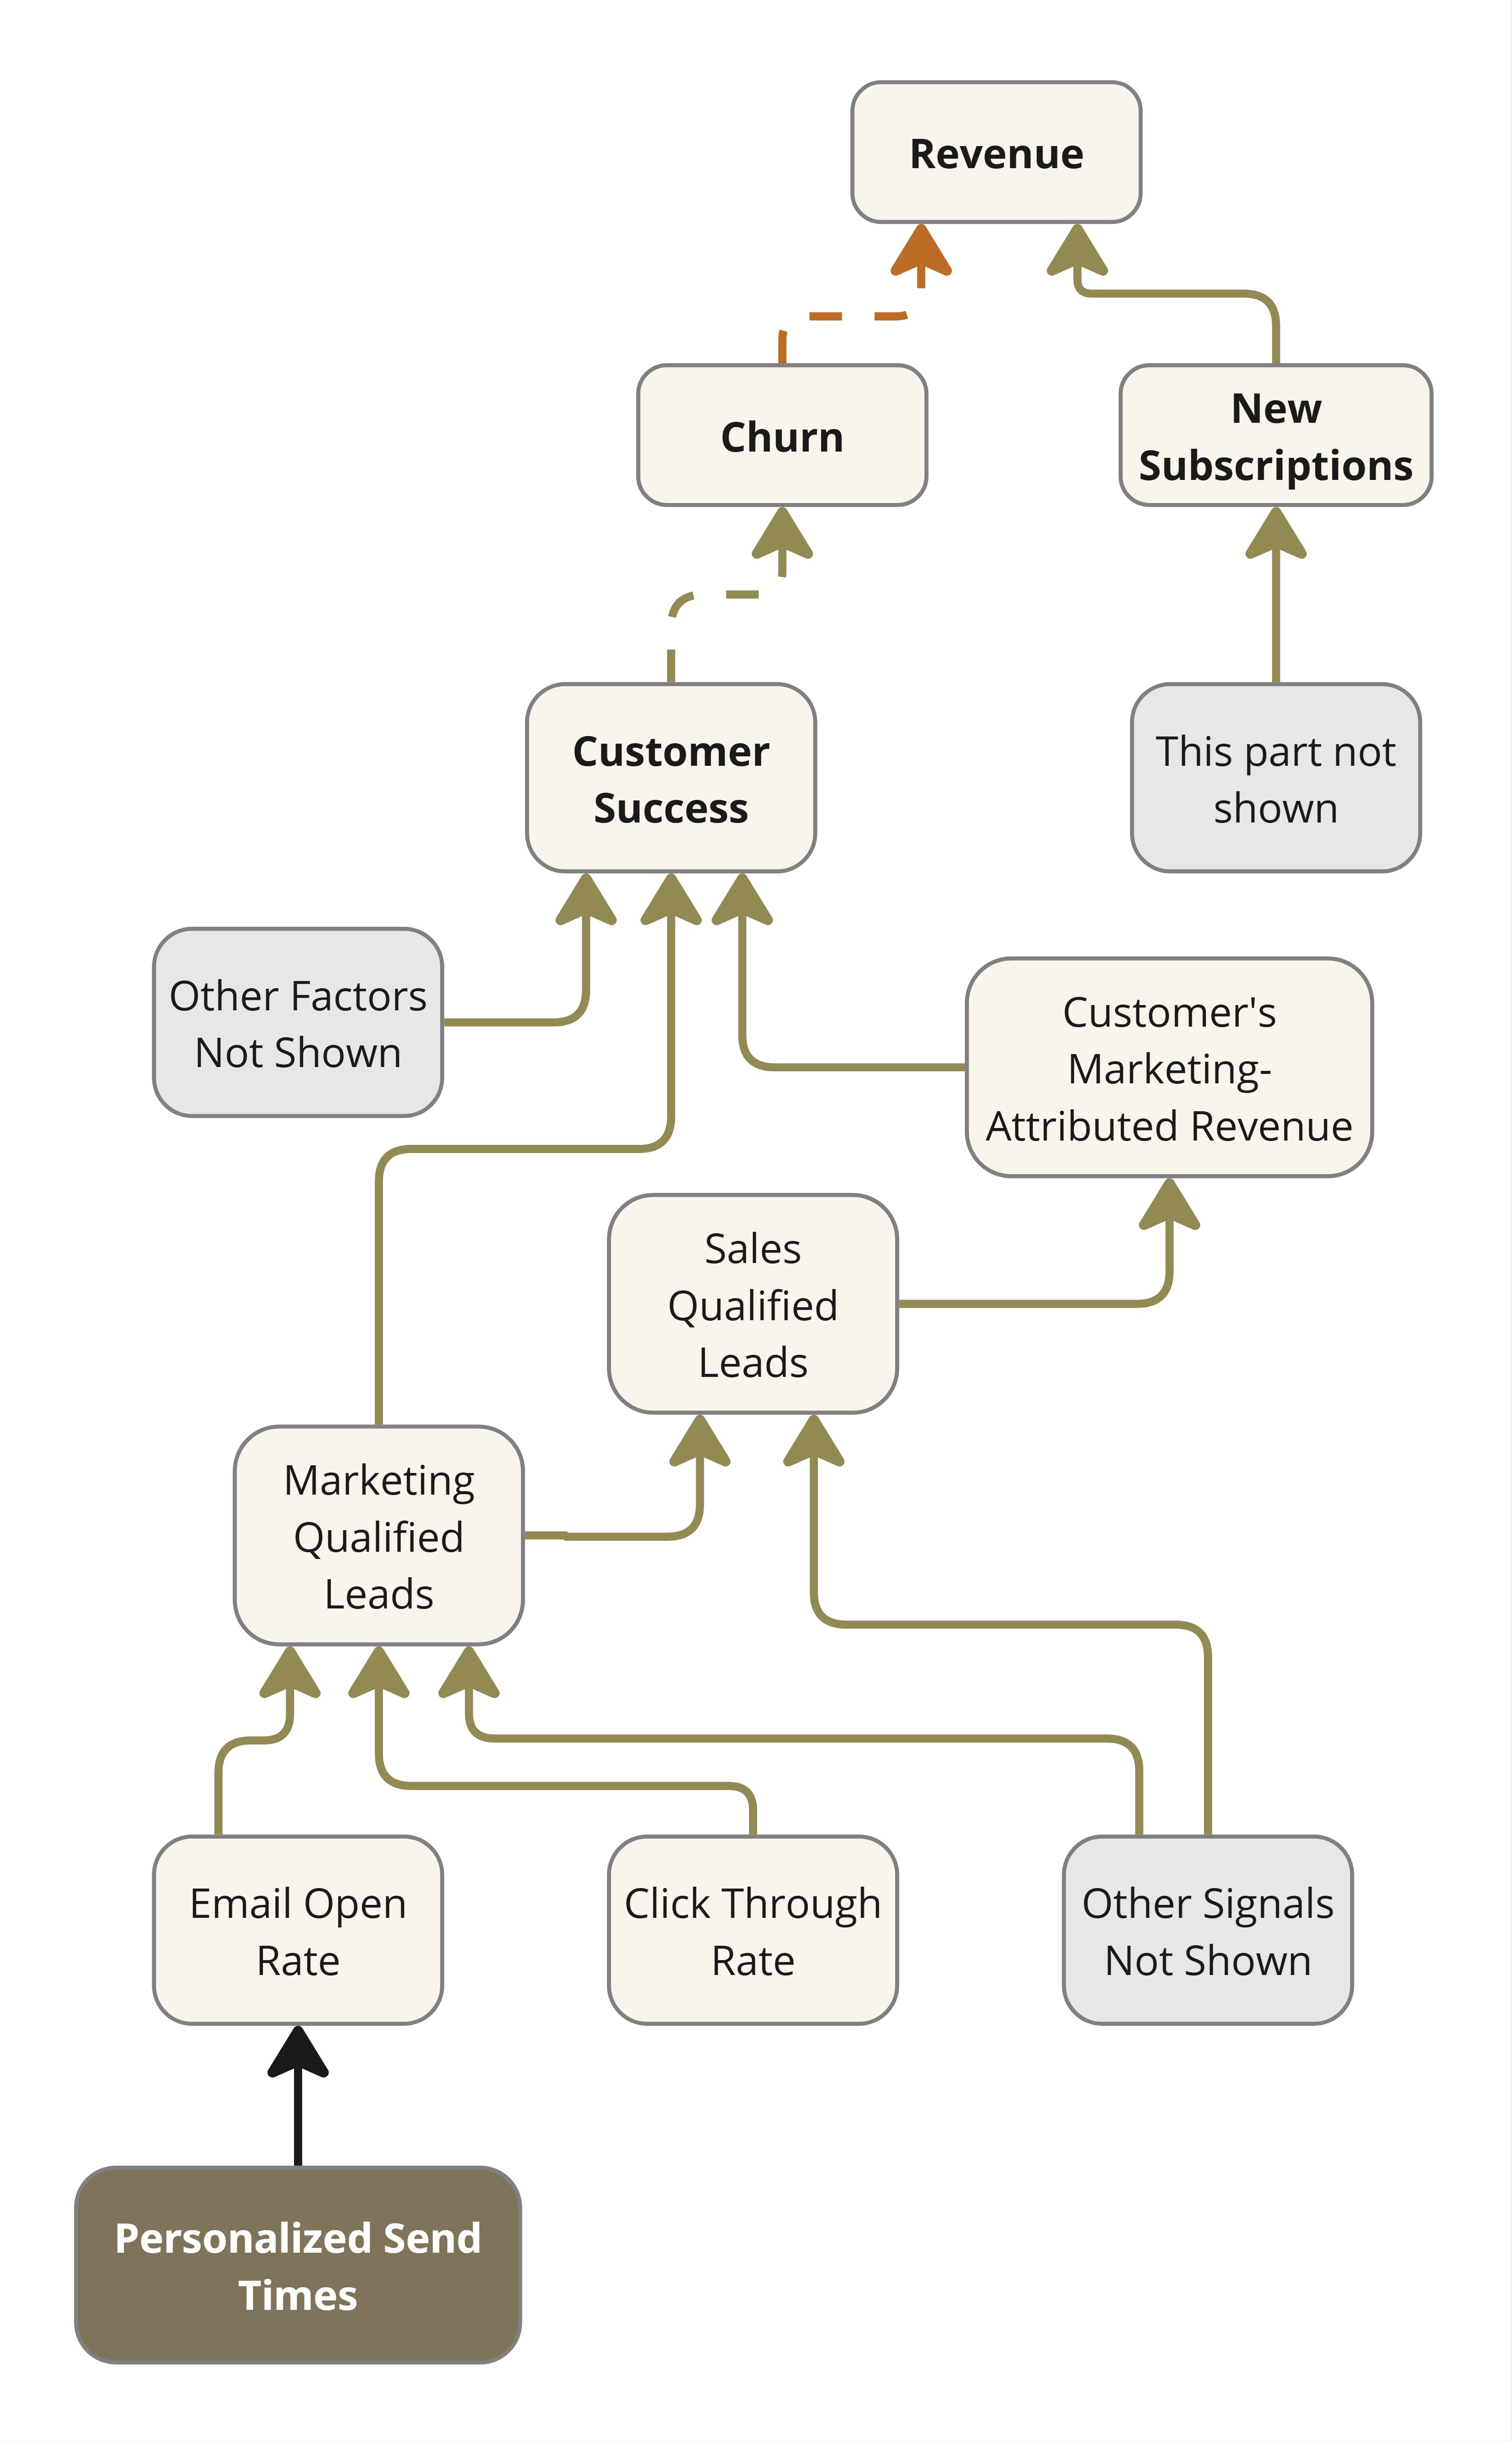
Figure 5: Impact Network for an Email Marketing SaaS
The clearest sign of customer success is how much additional revenue a customer could make through the leads generated via the use of this solution. Therefore, the product team keeps adding functionality to improve engagement with emails. For instance, they might decide to personalize the timing of email dispatch as per the recipient’s historical behavior. The implementation uses behavioral heuristics from open/click logs to identify peak engagement windows per contact. This information is fed to their campaign scheduler. What do you think is the measure of success of this feature? If you limit it to Email Open Rate or Click Through Rate you could verify with an A/B test. But that would be proximate impact only.
Leverage Points
Drawing up an impact network is a common first step. It serves as a commonly understood visual, somewhat like the ubiquitous language of domain driven design. To improve impact intelligence, leaders must address the flaws in their organization’s idea-to-impact cycle (Figure 6). Although it is displayed here as a sequence, iteration makes it a cycle.
Any of the segments of this cycle might be weak but the first (idea selection) and the last (impact measurement & iteration) are particularly relevant for impact intelligence. A lack of rigor here leads to the vicious cycle of spray-and-pray (Figure 1). The segments in the middle are more in the realm of execution or delivery. They contribute more to impact than to impact intelligence.
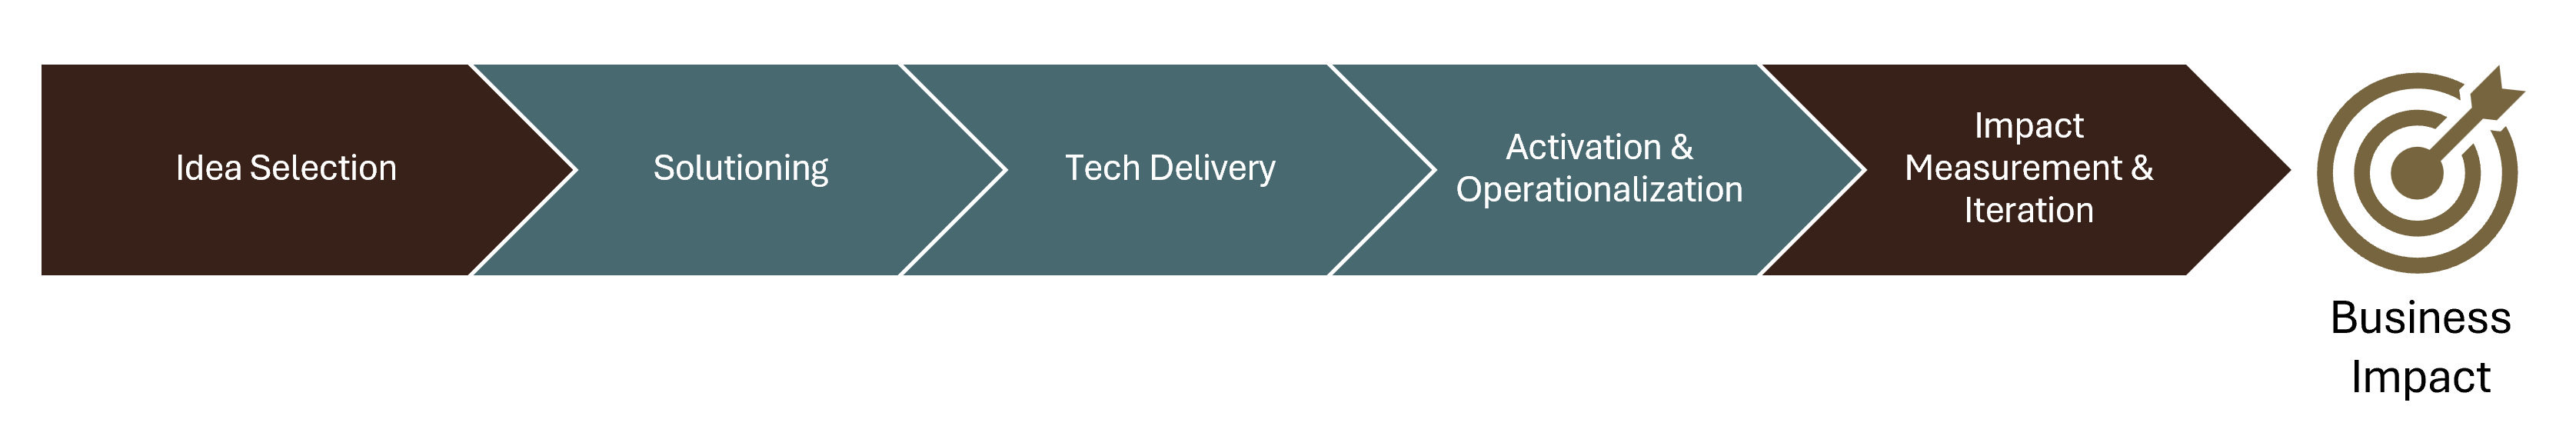
Figure 6: Leverage Points in the Idea to Impact Cycle
In systems thinking, leverage points are strategic intervention points within a system where a small shift in one element can produce significant changes in the overall system behavior. Figure 6 highlights the two leverage points for impact intelligence: idea selection and impact measurement. However, these two segments typically fall under the remit of business leaders, business relationship managers, or CPOs (Product). On the other hand, you—a tech CXO—are the one under productivity pressure resulting from poor business impact. How might you introduce rigor here?
In theory, you could try talking to the leaders responsible for idea selection and impact measurement. But if they were willing and able, they’d have likely spotted and addressed the problem themselves. The typical Classic Enterprise is not free of politics. Having this conversation in such a place might only result in polite reassurances and nudges not to worry about it as a tech CXO.
This situation is common in places that have grown Product and Engineering as separate functions with their own CXOs or senior vice presidents. Smaller or younger companies have the opportunity to avoid growing into this dysfunction. But you might be in a company that is well past this orgdesign decision.
Actions to Improve Impact Intelligence
As the next port of call, you could approach your COO, CFO, or CEO (the C-Suite Core) with the recommendations here. Perhaps buy them a copy of the book or make a summary presentation at a leadership offsite. The C-Suite Core approves investments, and they have the authority and the incentive to improve impact intelligence. They are best placed to improve governance of their investments. That’s the approach in the book. But what if that’s not feasible for some reason? What if their priorities are different?
Well, if you can’t have them actively involved, at least try to obtain their blessing for trying some reform on your own. It’s worth doing so because, as pointed out earlier, it is you who ends up paying the price of living with the status quo in this regard. Right, so here’s how to be a reformist (or activist) CTO.
Action #1: Introduce Robust Demand Management
Product may own idea triaging and prioritization, but they don’t always document their rationale for idea selection very well. Whether it takes the form of a business case or a justification slide deck, a good one ought to answer all the questions in the Robust Demand Management Questionnaire.
A commonly understood impact network helps answer some of the above questions. But what's absolutely essential for robust demand management is answers to the above, not the impact network. Answering the above makes for SMART (Specific, Measurable, Achievable, Relevant, Time-bound) ideas. Else they might be VAPID (Vague, Amorphous, Pie-in-the-sky, Irrelevant, Delayed). It is impossible to validate the business impact of VAPID ideas post tech delivery. This leads to the bad effects of Figure 1.
To mitigate this scenario, you must assert your right to allocate the bandwidth of your teams, an expensive business resource, to adequately documented ideas only. Do so for significant efforts only, not for every story or bug. Define your own thresholds, two person-weeks for example.
Make a distinction between prioritization and scheduling. The former is the act of assigning priority to a work item. The latter is about slotting the work-item into a work-cycle (e.g. sprint). Many organizations don't make this distinction and think of prioritization as inclusive of scheduling. Rethink this. Product still gets to prioritize. Scheduling has always been subject to practical considerations like dependencies or the availability of certain team members. It shall now also require answers to the above.
If the questions above were answered as part of idea triage, Engineering must obtain access to them. Robust demand management means that engineering teams only take up work that is documented as above, in addition to your usual documentation requirements (e.g. PRD). This means it is not just you, your teams too must understand the what, how and why of impact intelligence. More on this later.
Note that adequately documented does not necessarily mean well justified. Robust demand management does not mean Engineering makes a judgement call as to whether something is worth doing. It only makes sure that the projected benefits and timelines are documented in a verifiable manner. Product still gets to assign priority. To get the work scheduled, they could even answer “we don’t know” to some of the questions posed. At least we'll know how much of engineering capacity gets allocated to well-informed vs. ill-informed prioritization.
I helped Travelopia, an experiential travel company, implement an early version of robust demand management. Here’s a conference video where they talk about it.
This approach will have its detractors, especially among those at the receiving end of such robustness. They might deride it as gatekeeping. You must take the lead in explaining why it is necessary. A later section provides some guidance on how you could go about this. For now, I’ll only list the common objections.
- This will slow us down. We can’t afford that.
- Self-Censorship: Let’s put our house in order first.
- It’s not agile to consider all this upfront.
- Innovation isn’t predictable.
- Our PMO/VMO already takes care of this.
- This isn't collaborative.
- We don’t have the data.
The last one is more than an objection if it is a fact. It can be a showstopper for impact intelligence. It warrants immediate attention.
We Don’t Have The Data
Data is essential to answer the questions in the Robust Demand Management Questionnaire. Demand generators might protest that they don’t have the data to answer some of the questions. What’s a CTO to do now? At the very least you could start reporting on the current situation. I helped another client come up with a rating for the answers. Qualifying requests were rated on a scale of inadequate to excellent based on the answers to the questionnaire. The idea is to share monthly reports of how well-informed the requests are. They make it visible to COOs and CFOs how much engineering bandwidth is committed to working on mere hunches. Creating awareness with reports is the first step.
Awareness of gaps brings up questions. Why do we lack data? Inadequate measurement infrastructure is a common reason. Frame it as measurement debt so that it gets at least as much attention and funding as technical debt.
An organization takes on measurement debt when it implements initiatives without investing in the measurement infrastructure required to validate the benefits delivered by those initiatives.
Action #2: Pay Down Measurement Debt
Measurement debt is best addressed through a measurement improvement program. It comprises a team tasked with erasing blind spots in the measurement landscape. But it would require separate funding, which means a tech CXO might need to convince their COO or CFO. If that’s not feasible, consider doing it yourself.
Take the lead in reducing measurement debt. Advise your teams to instrument application code to emit structured impact-relevant events at meaningful points. Store it and use it to build analytics dashboards that will help validate proximate and downstream impact. They must be built alongside new functionality. Ensure to only fill the gaps in measurement and integration. No need to duplicate what might already be available through third party analytics tools that Product might already have in place. Measurement debt reduction might be easier if there's a product operations team in place. Your developers might be able to work with them to identify and address gaps more effectively.
The effort may be considered as part of coding for non-functional (cross-functional) requirements. Think of it as another type of observability: the observability of business impact. Do it only for important or effort-intensive functionality in the beginning. It is a bit unconventional, but it might help you be a more impactful CTO.
Read more about measurement debt here
Action #3: Introduce Impact Validation
When you adopt impact measurement as a practice, it allows you to maintain a report as shown in the table below. It provides a summary of the projection vs. performance of the efforts we discussed earlier. Product does this usually, and if so, Engineering should ask to participate. If Product isn’t doing it, Engineering should take the lead and drive it in order to avoid the spray and pray trap explained earlier. Otherwise, you won’t have an alternative proposal when you get badgered about developer productivity.
You now have the opportunity to conduct an impact retrospective. The answer to the question, “By how much and in what time frame” (item 3(b)(i) in the Robust Demand Management Questionnaire), allows us to pencil in a date for a proximateimpact retrospective session. The session is meant to discuss the difference between projection and performance, if any. In case of a deficit, the objective is to learn, not to blame. This informs future projections and feeds back into robust demand management.
| Feature/Initiative | Metric of Proximate Impact | Expected Value or Improvement | Actual Value or Improvement |
|---|---|---|---|
| Customer Support AI Chatbot | Average number of satisfactory chat sessions per hour during peak hours. | 2350 | 1654 |
| “Regu Nerd” AI Assistant | Prompts per analyst per week | > 20 | 23.5 |
| Time to initial recommendation | -30% | -12% | |
| Email Marketing: Personalized Send Times | Email Open Rate | 10% | 4% |
| Click Through Ratio | 10% | 1% |
It's okay if, in the first year of rollout, the actuals are much weaker than what was expected. It might take a while for idea champions to temper their optimism when they state expected benefits. It should have no bearing on individual performance assessments. Impact intelligence is meant to align funding with portfolio (of initiatives) performance.
Impact measurement works the same for downstream impact, but impact validation works differently. This is because unlike proximate impact, downstream impact may be due to multiple factors. The table below illustrates this for the examples discussed earlier. Any observed improvement in the downstream metric cannot be automatically and fully attributed to any single improvement effort. For example, you may notice that call volume has gone up by only 2.4% in the last quarter despite a 4% growth in the customer base. But is it all due to the customer support chatbot? That requires further analysis.
| Feature/Initiative | Metric of Downstream Impact | Expected Improvement | Observed Improvement (Unattributed) | Attributed Improvement |
|---|---|---|---|---|
| AI Chatbot | Call Volume (adjusted for business growth) | -2% | -1.6% | ? |
| “Regu Nerd” AI Assistant | Time to Decision | -30% | -5% | ? |
| Email Marketing: Personalized Send Times | MQL | 7% | 0.85% | ? |
| Marketing-Attributed Revenue | 5% | Not Available | ? |
Retrospectives for downstream impact are meant to attribute observed improvements to the initiatives at play and to other factors. This is called contribution analysis. This is harder for Engineering to drive because they require all contributing initiatives, even those outside Engineering, to participate. They are best scheduled monthly or quarterly, convened by a business leader who has a stake in the downstream metric in question. Therefore, they might be a bridge too far, even for a reformist CTO. Nonetheless, you could still make sure that the measurements are in place for the retrospective to take place, should the business leader so choose.
For the sake of completeness, Figure 7 shows what the results of a downstream impact retrospective might look like for the example of the customer support chatbot.
It shows that call volumes only rose by 2.4% quarter-on-quarter despite a 4% growth in the customer base. The model assumes that if nothing else changes, the change in call volume should match the change in the customer base. We see a difference of 1.6 percentage points or 160 basis points. How do we explain this? Your data analysts might inform you that 60 bps is explained by seasonality. We credit the rest (100 bps) to self-service channels and ask them to claim their contributions. After a round of contribution analysis, you might arrive at the numbers at the bottom. You could use some heuristics and simple data analysis to arrive at this. I call it Simple Impact Attribution to contrast it with more rigorous methods (e.g., controlled experiments) that a data scientist might prefer but which might not always be feasible.
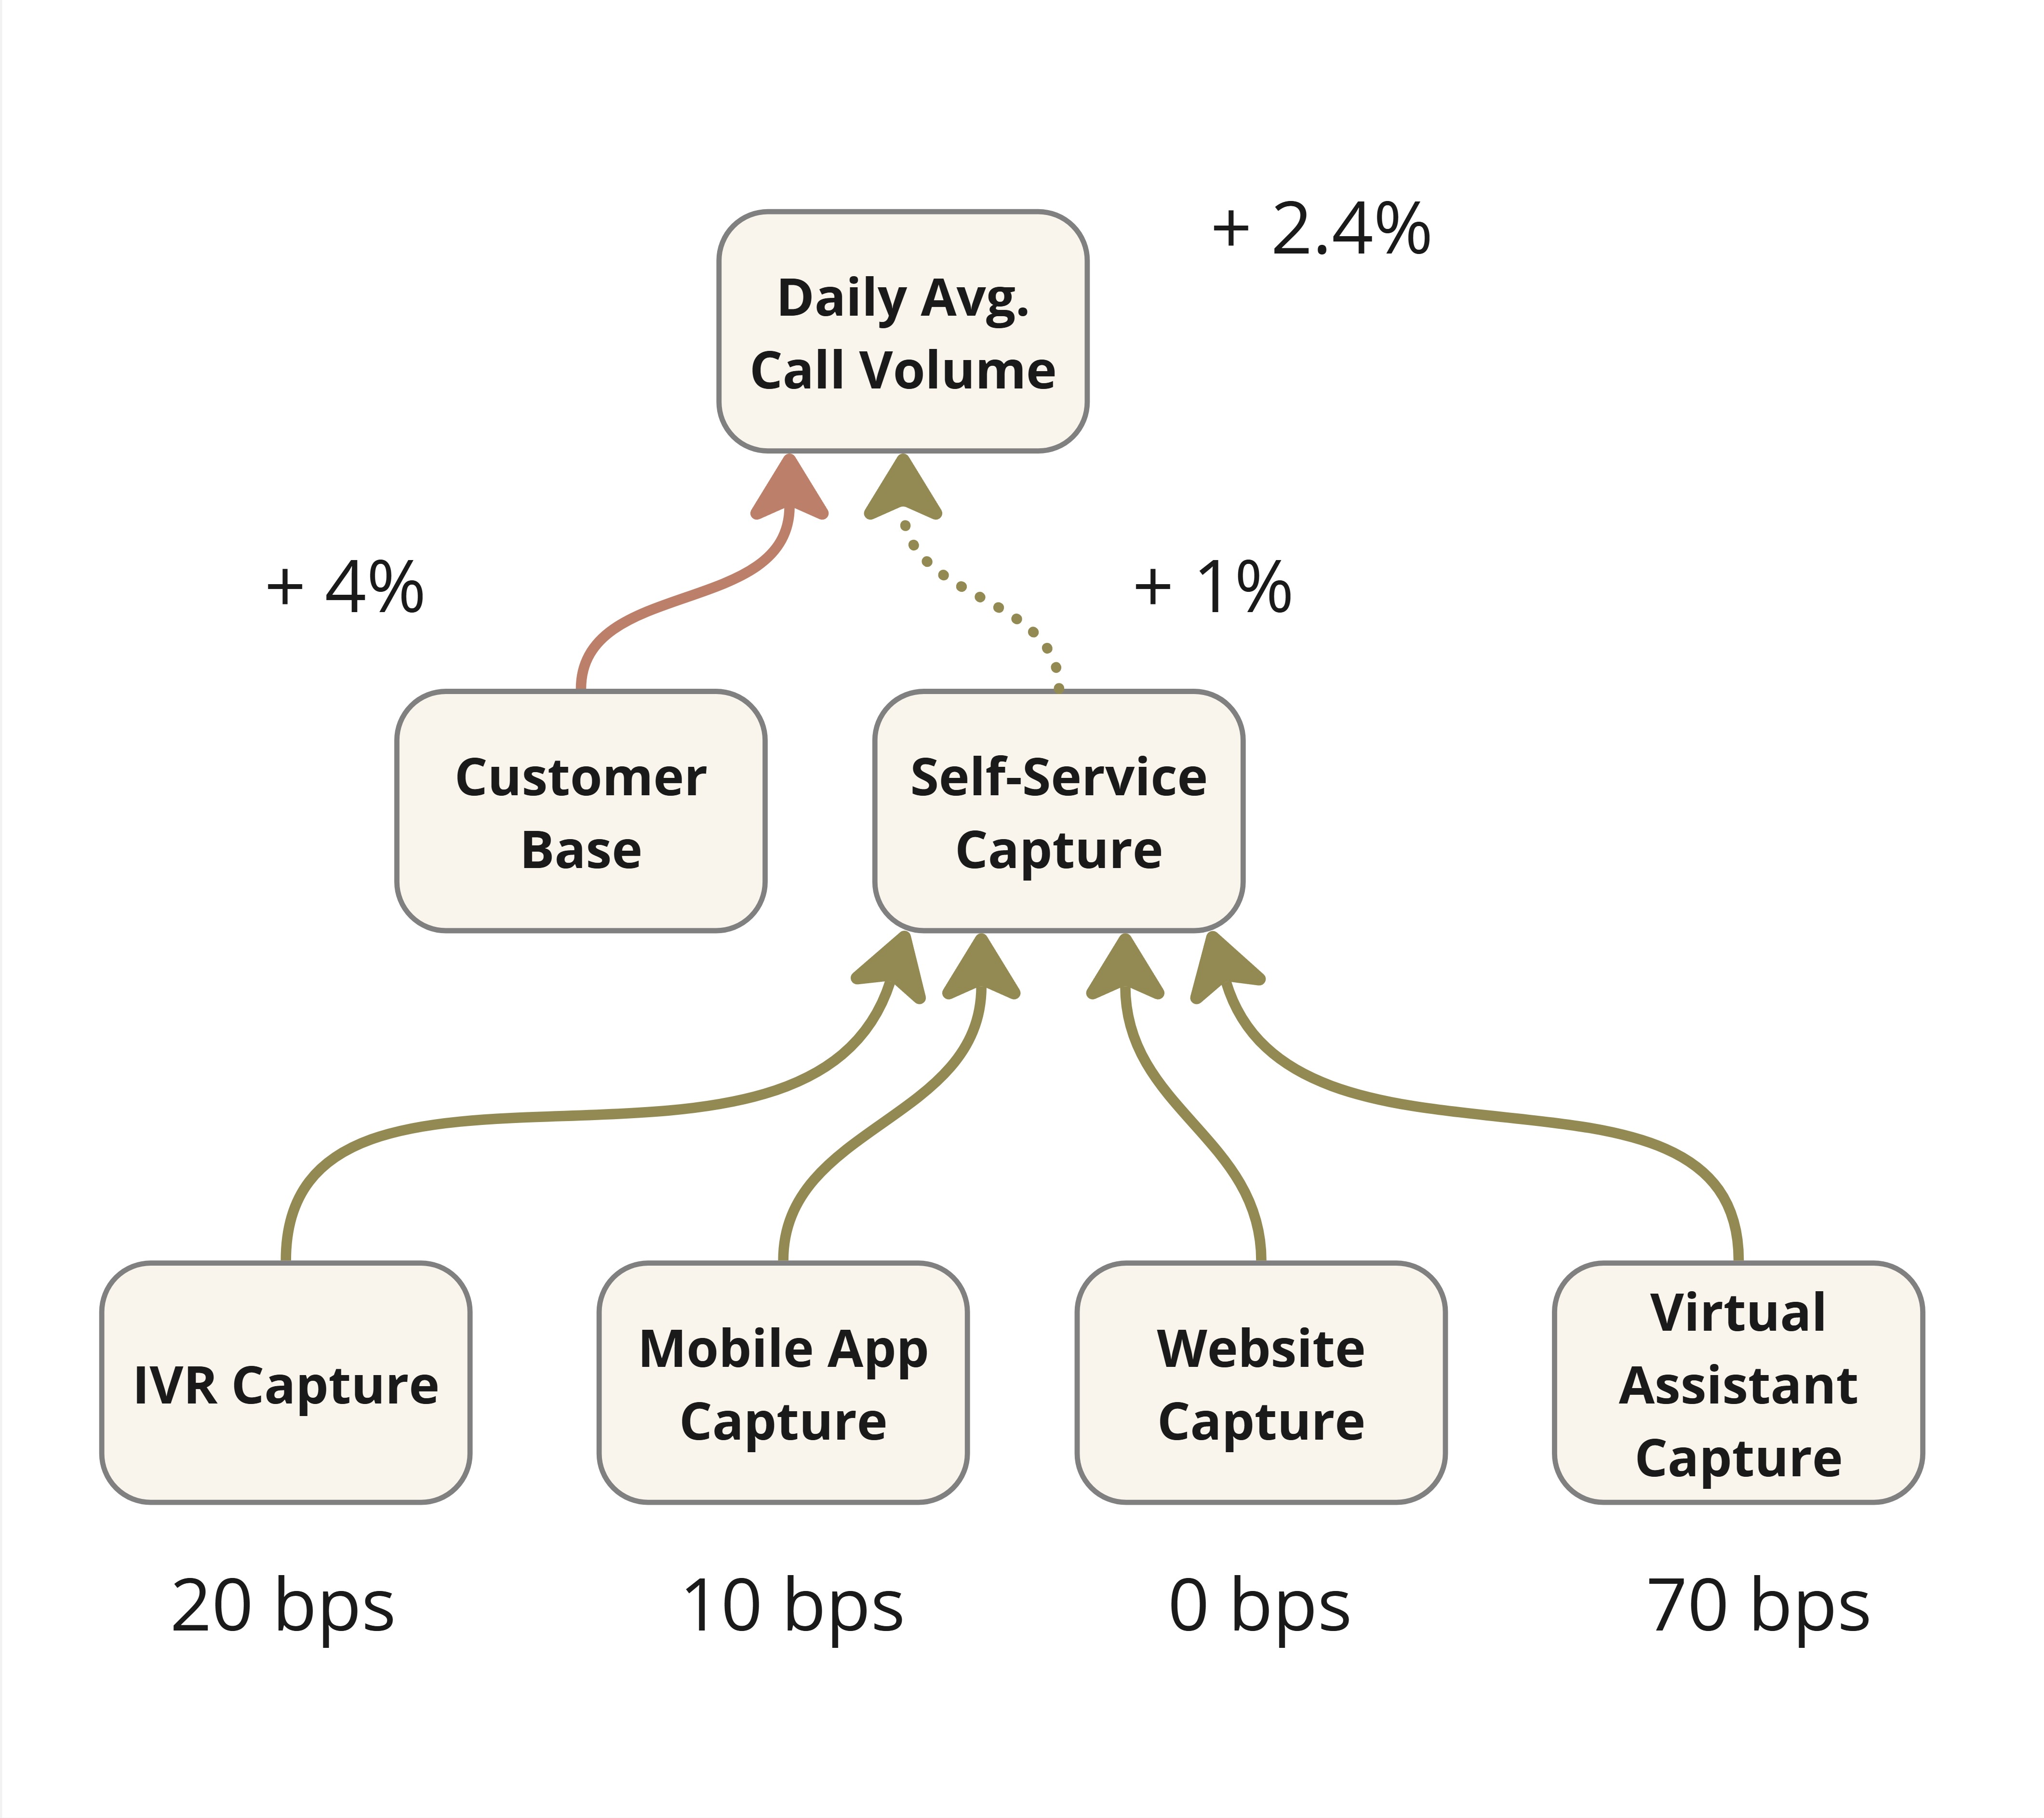
Figure 7: Example of Impact Attribution
Action #4: Offer your CFO/COO an alternative to ROI
These days, no one knows the ROI (return on investment) of an initiative. Projections made to win approval might not be in strict ROI terms. They might just say that by executing initiative X, some important metric would improve by 5%. It is not possible to determine ROI with just this information. But with the results of impact validation in place as above, you might be able to calculate the next best thing, the Return on Projection (ROP). If the said metric improved by 4% as against the projected 5%, the ROP, also called the benefits realization ratio, is 80%. Knowing this is way better than knowing nothing. It’s way better than believing that the initiative must have done well just because it was executed (delivered) correctly.
ROP is a measure of projection vs. performance. A tech CXO could encourage their COO/CFO to make use of ROP to make better investment decisions in the next round of funding. Asking for a thorough justification before funding is good, but they are based on assumptions. A projection is invariably embedded in the justification. If they only decide based on projections, it incentivizes people to make unrealistic projections. Business leaders may be tempted to outdo each other in making unrealistic projections to win investment (or resources like team capacity). After all, there is no way to verify later. That’s unless you have an impact intelligence framework in place. The book has more detail on how to aggregate and use this metric at a portfolio level. Note that we are not aiming for perfect projections at all. We understand product development is not deterministic. Rather, the idea is to manage demand more effectively by discouraging unrealistic or unsound projections. Discourage spray and pray.
Action #5: Equip Your Teams
It can feel lonely if you are the only senior exec advocating for greater impact intelligence. But you don’t have to run a lonely campaign. Help your delivery teams understand the big picture and rally them around to your cause. Help them appreciate that software delivery does not automatically imply business impact. Even feature adoption does not. Start by helping them understand the meaning of business impact in different contexts. I have found it useful to explain this with an illustration of a hierarchy of outcomes as in Figure 8 The ones at the top are closest to business impact. The lower-level outcomes might support or enable the higher-level outcomes, but we should not take that for granted. Impact intelligence is about tracking that the supposed linkages work as expected. When your teams internalize this hierarchy, they’ll be able to help you implement robust demand management even more. They’ll begin to appreciate your nudges to reduce measurement debt. They’ll start asking Product and business leaders about the business impact of functionality that was delivered.
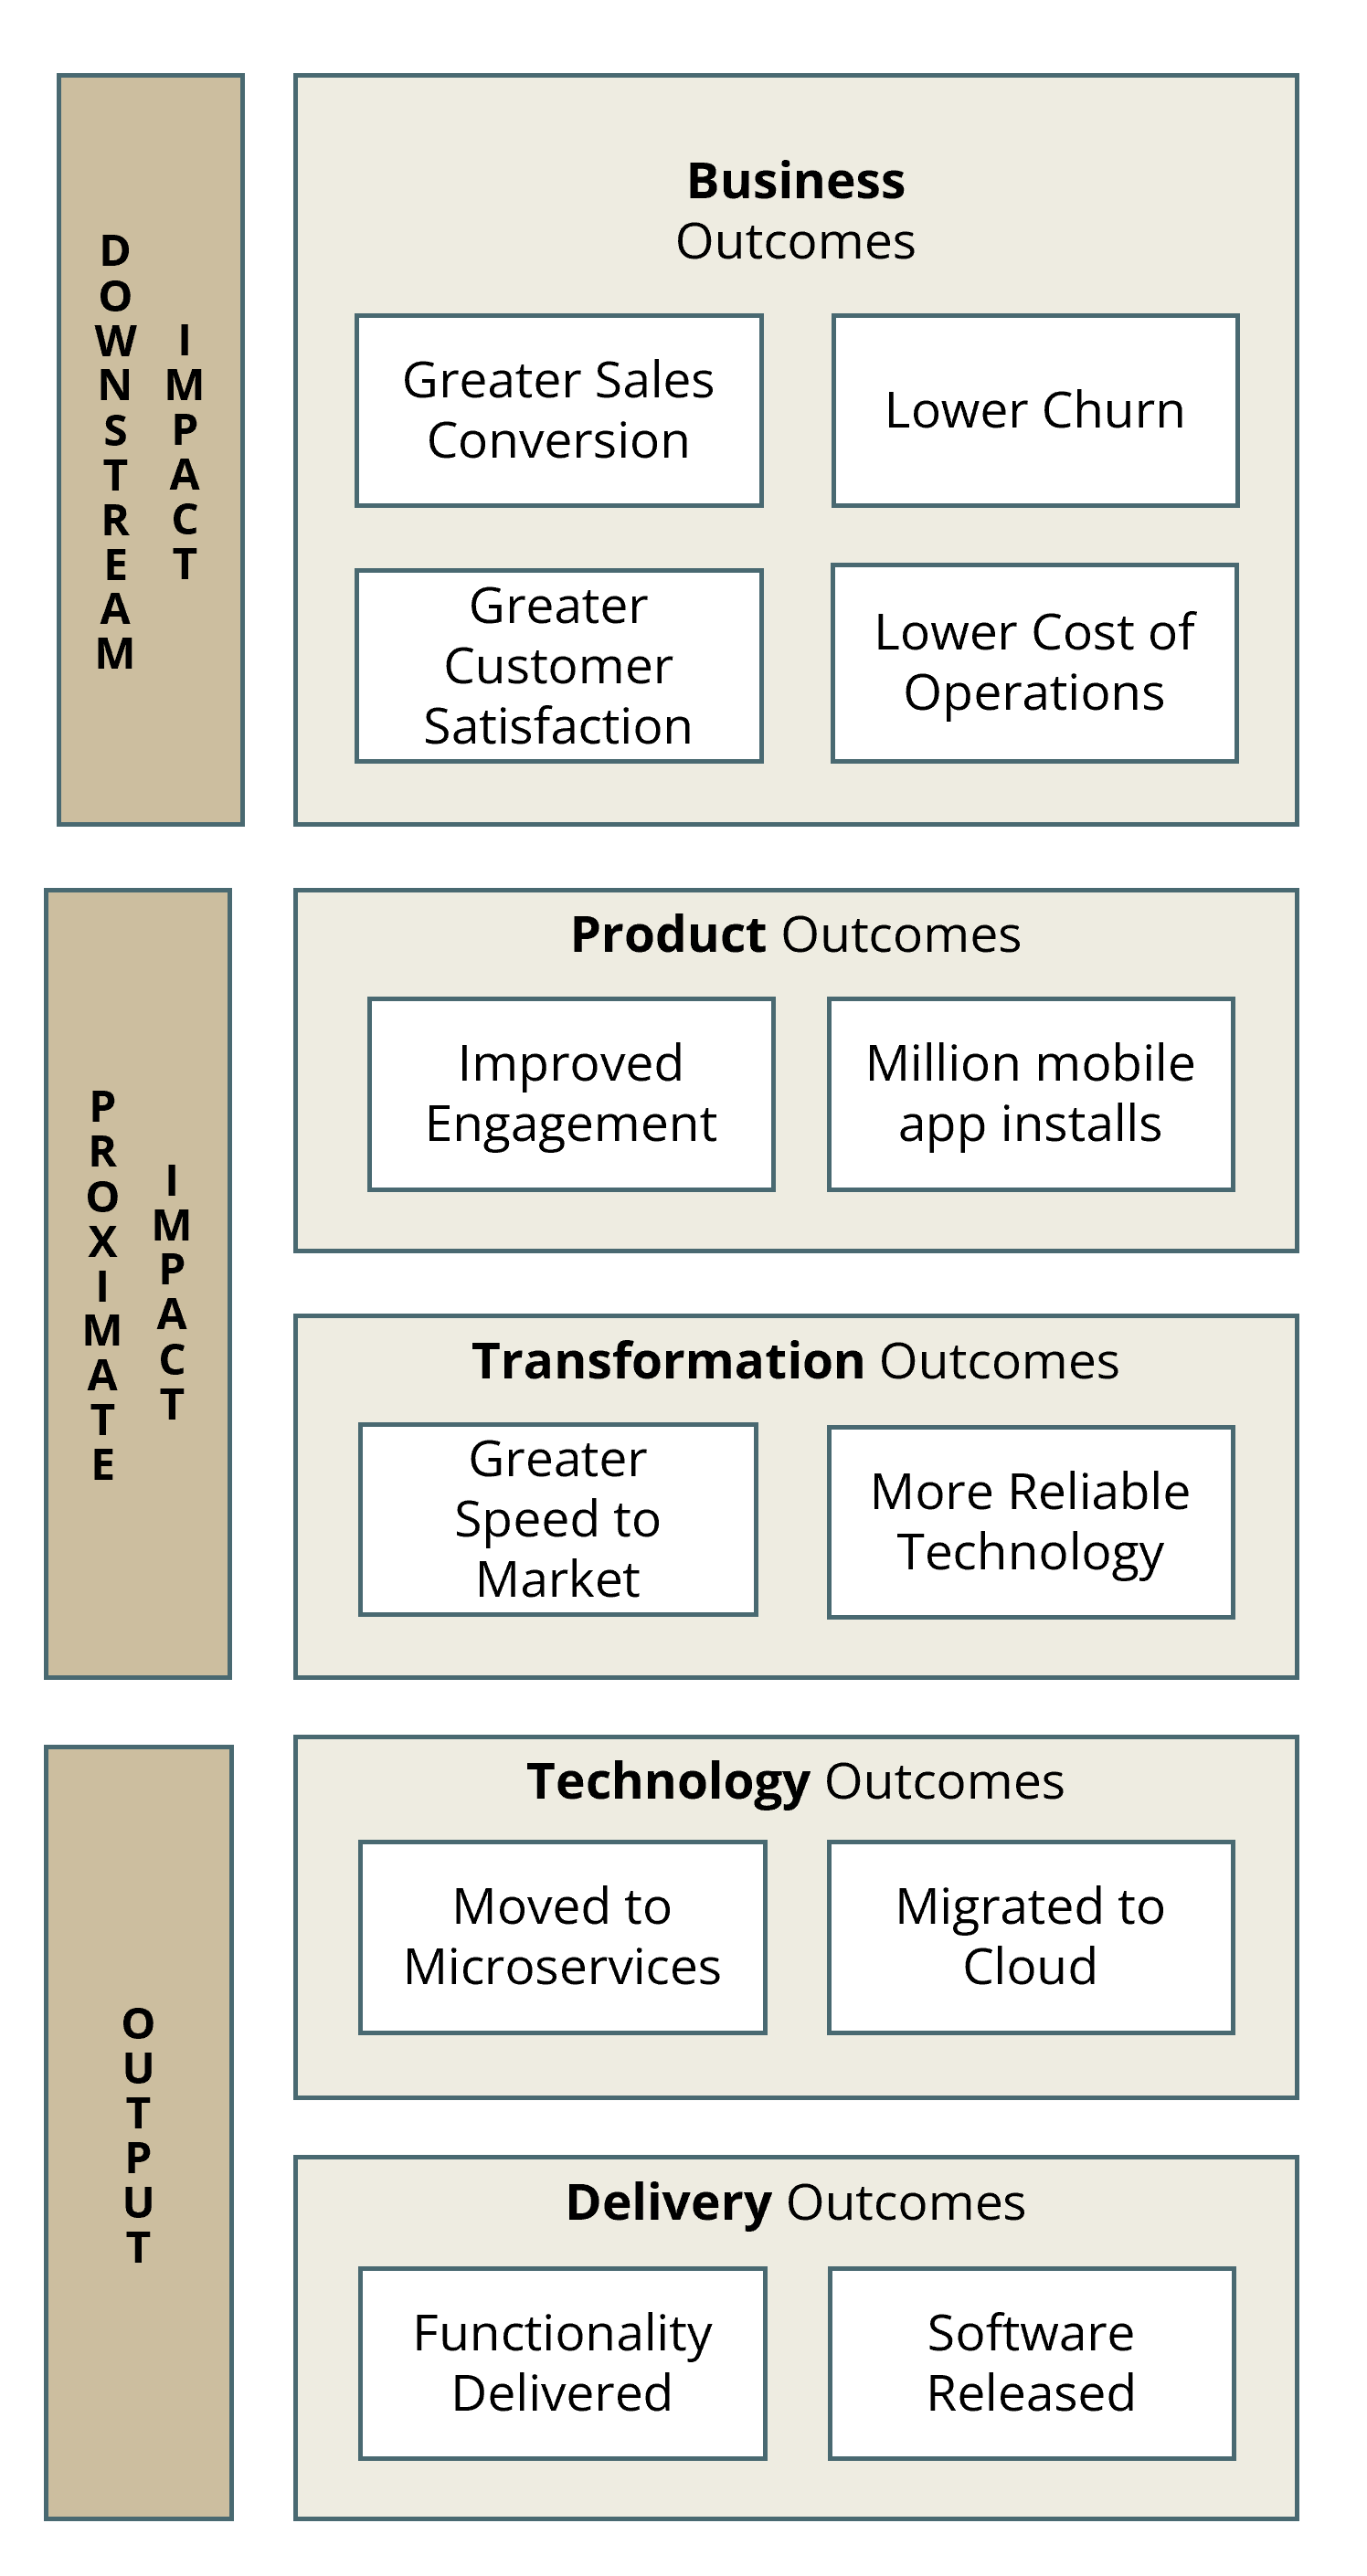
Figure 8: A hierarchy of outcomes
Objections
The action suggested first, introducing robust demand management, is key to the other four suggested actions. As noted earlier, it might encounter resistance from the people at its receiving end. Here's how to address five common objections to answering the robust demand management questionnaire.
Objection #1: We can’t slow down
Detractors commonly push back against robust demand management by saying, “We don’t have the time to answer these questions. Let’s ship it already.” That’s a mad trade-off of accuracy for speed. Accuracy, as in preparing well to achieve the desired impact. Neglecting it for speed is exactly what Figure 1 illustrates as the spray-and-pray dysfunction, a scattershot approach that is ultimately unsustainable. Spray-and-Pray implies a lack of precision and a reliance on luck rather than skill or strategy. Anything that requires skill and strategy must be learnt for accuracy first and for speed later. When accuracy is lacking, it helps the cause of business impact if you slow down a bit to gain accuracy. Think of it like playing chess.
Note that none of the suggested actions require you to dial down any exisitng efforts to improve productivity or flow. The reformist CTO does not neglect efficiency. They aim to balance the pursuit of efficiency with the pursuit of effectiveness. They recognize that the Classic Enterprise has gone off balance by fixating on software delivery agility (process and output) and neglecting business agility (impact).
Objection #2: Let’s put our house in order first
An overly conscientious CTO might hesitate to adopt robust demand management until, for instance, all their DORA metrics achieve elite status. They might think of it as putting their house in order first. This is misplaced sincerity. What’s the point of multiple deploys per day if impact intelligence is lacking? It’s just another variant of the speed over accuracy fallacy.
This way of thinking might also be a sign of a siloed organization. An implicit understanding might exist that Engineering should only concern itself with speed and quality of delivery (build it right, build it fast) and let Product (or BRMs) take care of accuracy (build the right thing to create business impact). But without impact intelligence, accuracy is unknown. It is an article of faith. Faith in the idea-triage process or faith that others’ have benefitted from doing XYZ so we must too. If you believe that this state of affairs has led to a spray-and-pray feature factory (a likely scenario), you’d do yourself a favor by not worrying too much about putting your own house in order first.
Objection #3: It’s Not Agile
Sometimes, product people or business relationship managers look at all the questions in the Robust Demand Management Questionnaire and go, “It’s too much upfront analysis! It’s not agile.” Well, we are not getting deep into the solution. We are just documenting the hypothesis well. Agile doesn’t mean you jump out of the airplane and figure out how and where to land while you are mid-air. It is perfectly okay to plan and then iterate.
Besides, there usually are lots of ideas competing for limited engineering bandwidth which, as noted earlier, is an expensive business resource. The size of your product backlog is an indicator of the volume of demand. Therefore, it is important to shortlist carefully when the first round of selection (by Product or your BRMs) is not as careful.
AI-enabled productivity boost promises to make limited engineering bandwidth less of an issue. But simply churning out more functionality without impact intelligence only reinforces the vicious cycle of Figure 1
The Agile Manifesto bats for working software over comprehensive documentation but that is not about documenting the rationale for developing said software. Working software doesn't always result in business impact, unfortunately. Neither do we run afoul of the principle of responding to change over following a plan. The Robust Demand Management Questionnaire is not a plan.
Objection #4: Innovation Isn’t Predictable
Idea champions might protest that they can't be sure of the benefits early on. Then let’s stop pretending otherwise at the time of prioritization and scheduling. Let’s not make unrealistic projections just to get in front of the line. If they believe in their projections, let’s document these beliefs via the questionnaire and revisit them post delivery. If we want to go ahead and build functionality even when we have no credible information as to their benefit, let’s record that too. Those who sign the cheques ought to know how much of their funding is for shots in the dark, or even in a fog.
It's not about eliminating failure either. Failure is a part of innovation. My point is that the Classic Enterprise often does not even realize that an initiative has failed to deliver adequate business impact. If they did, they would decommission what was built and thereby avoid tech bloat (run costs) on that account.
Objection #5: Our PMO/VMO already takes care of this
No, they don't. They might have an idea justification template, but they don't have the means or the mandate to verify impact after delivery. Besides, their template might lack pointed questions, or they might be resigned to accepting vague answers. Sometimes, they dubiously report benefits realized in terms of work completion or money spent. As in, if we have delivered the functionality or spent the money, we must have realized the expected business impact!
On the other hand, if they truly have an equivalent questionnaire in place, and it is filled out properly before work arrives at your doorstep, use it by all means to carry out the other suggested actions. No need to duplicate.
Objection #6: This isn't Collaborative
Change is hard. As a reformist CTO, you are trying to do what you can to make a real difference, but you might be accused of not being collaborative. Those used to getting their whims prioritized (and scheduled) might complain that you are being an unauthorized gatekeeper. This is why you should seek the blessings of your COO/CFO prior to embarking on this journey of reform.
One more thing. Although I introduced the term in this article for the sake of clarity, you should perhaps not use the phrase Robust Demand Management when you socialize or introduce it. Consider calling it Verifiable Ideas or Ideas with Full Disclosure.
Act Now
If your counterparts and seniors outside technology aren’t taking the lead in improving impact intelligence, it is in your (and the company’s) interest that you take the lead and act. Institute robust demand management. Pay down measurement debt. Introduce impact validation and share reports of projection vs. performance. Equip your teams to work toward business impact. By doing so, you should be able to get the developer productivity monkey off your back and more importantly, be able to take the lead in improving the business impact of discretionary spend.
The actions suggested aren't easy. They might even seem daunting enough that you'd prefer to deal with the productivity challenge than attempt being a reformist CTO. But then, you might never be able to speak to true business impact. You might have to resign yourself to the vicious cycle of Figure 1 . And the C-Suite Core will always view your role as executional: focussed on technology delivery, infrastructure, and operations. No shame in that, unless you believe you can do better.
Additional Resources
To equip yourselves better to appeal to your COO/CFO on this topic, it might be best to read the book which is aimed at them. You could get a sense of its approach by reading the free first chapter and my article in Armstrong Wolfe's COO Magazine. If you'd like to explore more from a tech lens, you could watch this podcast by the Tech Lead Journal or this conference talk I gave earlier this year.
Acknowledgements
Many thanks to the reviewers: Charles Betz, Dan Leeds, Emilia Sherifova, Jeff Foster, Jeff Gardner, Martin Fowler, Dr.Martin Strunk, Thirukumaran Karunanidhi, Uttam Kini, Andrew Thal, and Chris Chakrit Riddhagni. Additional, special thanks to Martin Fowler for his help and guidance with editing and publishing.
Footnotes
1: A couple of reviewers said that the impact network reminds them of other formulations. One pointed to cascading OKRs. Another pointed to Gojko Adzic's impact mapping. I guess it could remind you of any formulation that uses a tree-like visual to talk about impact. But a careful reading should convince you that the impact network stands on its own as a specific type of KPI tree. Its seeds were sown in an earlier visual called Alignment Maps.
Significant Revisions
12 August 2025: published final installment
07 August 2025: published actions
06 August 2025: published impact intelligence section